Proxmox is a robust and scalable virtualization platform, and monitoring its performance is crucial for maintaining optimal operations. Integrating Grafana and InfluxDB provides an intuitive way to visualize and analyze your Proxmox cluster's metrics. In this guide, we will walk you through setting up monitoring for a Proxmox cluster using the Metric Server menu to send data to InfluxDB and then visualizing it in Grafana.
Prerequisites
Before starting, ensure you have the following:
- A Proxmox cluster installed and configured.
- An InfluxDB instance (preferably v2.x) set up and accessible.
- Grafana installed and accessible.
- Network connectivity between Proxmox, InfluxDB, and Grafana.
Step 1: Configure InfluxDB for Proxmox
You can configure Grafana and InfluxDB in Docker Swarm with this blog post :

- Create a Bucket in InfluxDB:
- Log in to your InfluxDB instance.
- Navigate to Data > Buckets.
- Click Create Bucket and name it (e.g.,
proxmox_metrics).
- Generate an API Token:
- Go to Data > Tokens.
- Click Generate API Token and associate it with the bucket you created.
- Save the token for later use.
Step 2: Configure Proxmox to Send Metrics to InfluxDB
- Access the Metric Server Menu:
- Log in to the Proxmox web interface.
- Navigate to Datacenter > Options > Metric Server.
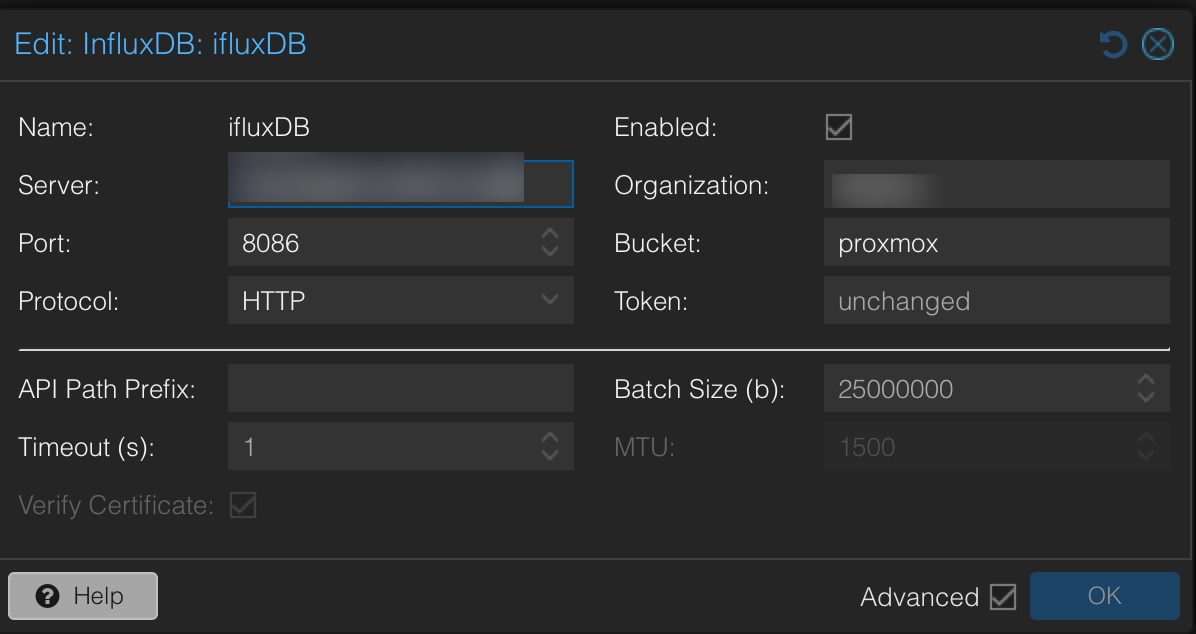
- Add a New Metric Server:
- Click Add and select InfluxDB.
- Fill in the required details:
- ID: A unique identifier for this server (e.g.,
influxdb_server). - Server: The URL of your InfluxDB instance (e.g.,
http://your-influxdb-server:8086). - Port: Typically
8086for InfluxDB. - Organization: Your InfluxDB organization name.
- Bucket: The name of the bucket you created earlier.
- Token: Paste the API token you generated.
- ID: A unique identifier for this server (e.g.,
- Test the Connection:
- Click Test Connection to ensure Proxmox can communicate with InfluxDB.
- Enable Metrics Collection:
- Once the connection is verified, save the configuration.
Step 3: Set Up Grafana to Visualize Metrics
- Add InfluxDB as a Data Source in Grafana:
- Log in to Grafana.
- Navigate to Configuration > Data Sources.
- Click Add data source and select InfluxDB.
- Fill in the required details:
- URL: The same URL used in Proxmox (e.g.,
http://your-influxdb-server:8086). - Organization: Your InfluxDB organization name.
- Token: Use the API token.
- Bucket: Specify the bucket name.
- URL: The same URL used in Proxmox (e.g.,
- Click Save & Test to verify the connection.
- Import or Create Dashboards:
- You can create a custom dashboard or use a pre-built Proxmox dashboard.
- To import a dashboard:
- Navigate to Dashboards > Manage > Import.
- Paste a JSON configuration or use an ID from Grafana’s public dashboard repository. 15356 is a good one
- Map the variables to the data source you configured.
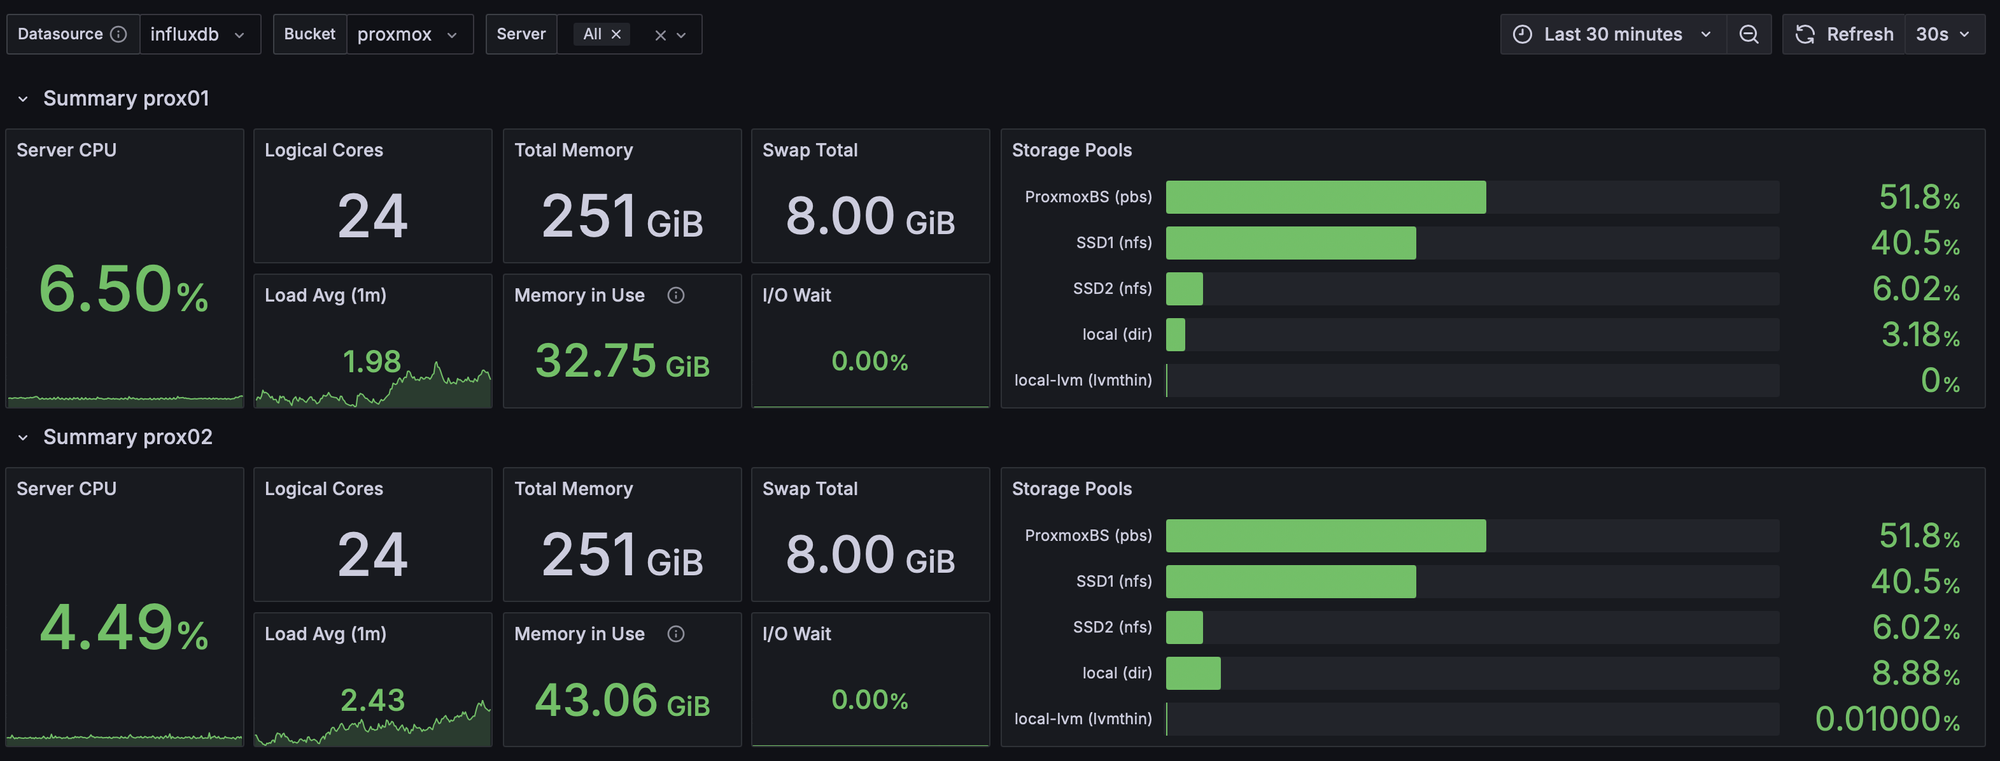
- Add Panels to the Dashboard:
- Create panels to visualize metrics such as CPU usage, memory consumption, storage IO, and network traffic.
- Use queries to fetch relevant data from InfluxDB.
Step 4: Fine-Tune Monitoring
- Set Alert Rules:
- In Grafana, configure alerts for critical metrics like high CPU usage or low disk space.
- Optimize Retention Policies in InfluxDB:
- Set retention policies to manage data storage and ensure long-term availability.
- Validate and Test:
- Continuously monitor the dashboards to ensure data accuracy.
- Test alert mechanisms to verify notifications.
Conclusion
By integrating Proxmox with InfluxDB and Grafana, you can create a powerful monitoring setup that provides real-time insights into your cluster’s performance. The Metric Server menu in Proxmox makes it straightforward to forward metrics to InfluxDB, and Grafana's visualization capabilities enable you to stay ahead of potential issues. Happy monitoring!


