
haproxy
HAProxy Odyssey: From NetScaler to BGP Anycast
From cutting cost-heavy Citrix nets to mastering BGP Anycast, my HAProxy journey shows how resilience, security, and automation evolve.
From cutting cost-heavy Citrix nets to mastering BGP Anycast, my HAProxy journey shows how resilience, security, and automation evolve.
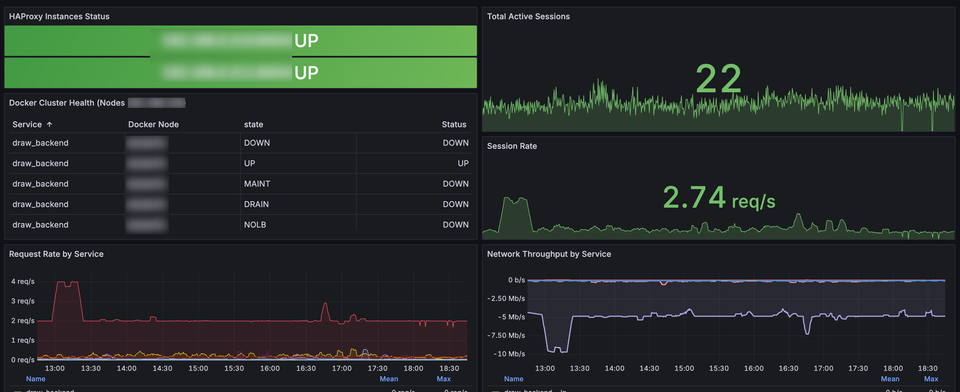
Complete HAProxy HA monitoring using Prometheus and Grafana. Custom dashboard with eight panels covering instance health, throughput and error rates. Includes automated alerts for critical failures.

Uptime Kuma is a self-hosted monitoring tool that allows you to keep track of your websites, services, or APIs with ease. In this guide, we'll go through the process of deploying Uptime Kuma on a Docker Swarm cluster using a highly available configuration.
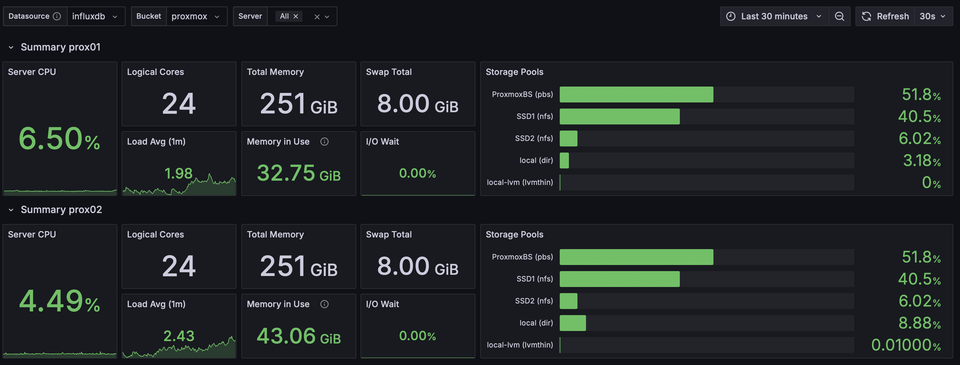
Proxmox is a robust and scalable virtualization platform, and monitoring its performance is crucial for maintaining optimal operations. Integrating Grafana and InfluxDB provides an intuitive way to visualize and analyze your Proxmox cluster's metrics.

Monitoring environments is critical for maintaining the performance and reliability of modern applications. This blog post details the setup of a monitoring stack in Docker Swarm using Prometheus, Grafana, and InfluxDB. We'll focus on a practical example using NFS for shared storage...
I needed to monitor my Lab at home and check what I could do with Cacti to monitor Citrix XenServer,
Today I needed to enable SNMP on my XenServer lab at home, I was looking for an efficient way to