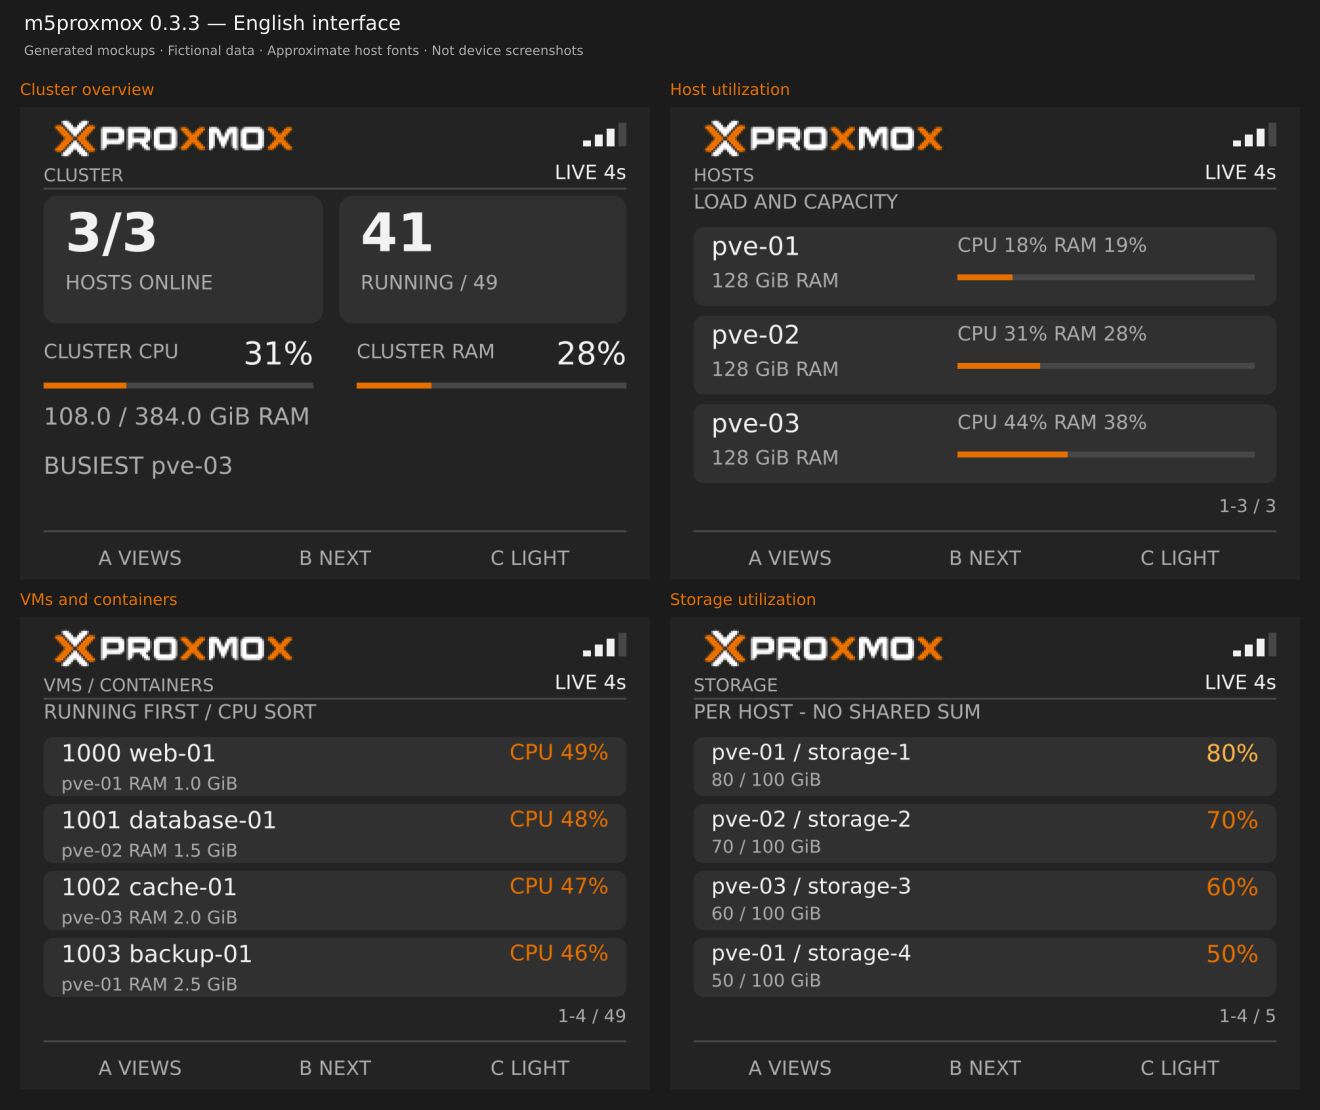
I don't always need the full Proxmox interface. Sometimes I just want to glance at the desk and check whether a host is offline, a VM is busy or storage is filling up.
That's what m5proxmox is for: a small, read-only dashboard running on an M5Stack ESP32. It puts the cluster's resource usage on a dedicated screen, without another browser tab to keep open.
A small box with four views
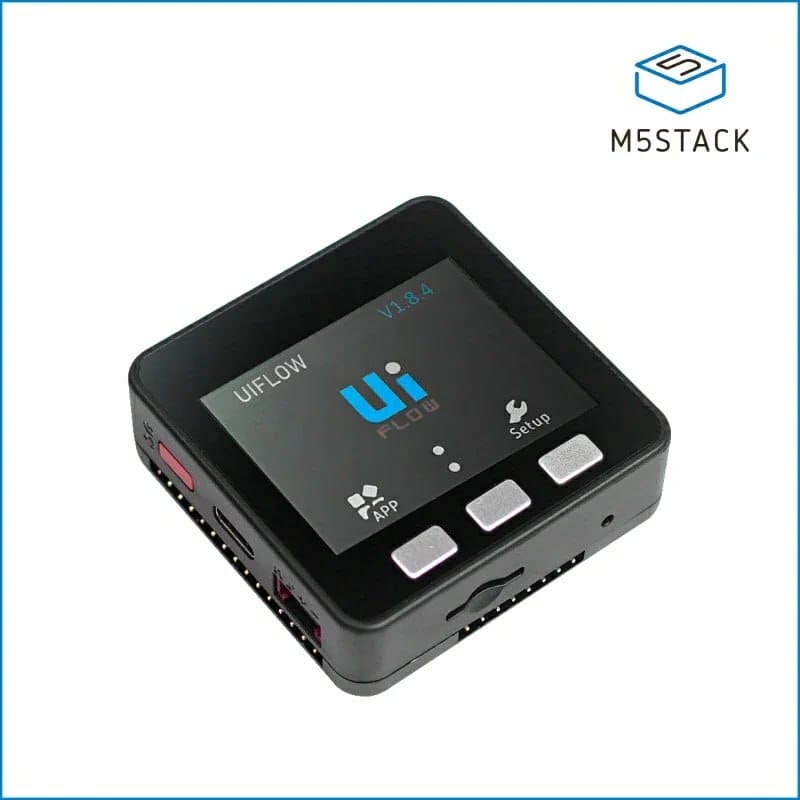
The device is an M5Stack BASIC V2.7, with a 320 × 240 colour display and three physical buttons. It connects over Wi-Fi and reads the Proxmox API over HTTPS. No extra dashboard server is needed.
There are four views:
- Cluster: online hosts, running VMs and containers, CPU and RAM usage, and the host needing attention.
- Hosts: status and resource usage for three machines at a time.
- VMs and containers: four guests per screen, with running guests first, then sorted by CPU usage. Names, IDs, host and RAM stay visible.
- Storage: used and total capacity, sorted by utilisation. Shared storage isn't counted several times just because several hosts can see it.
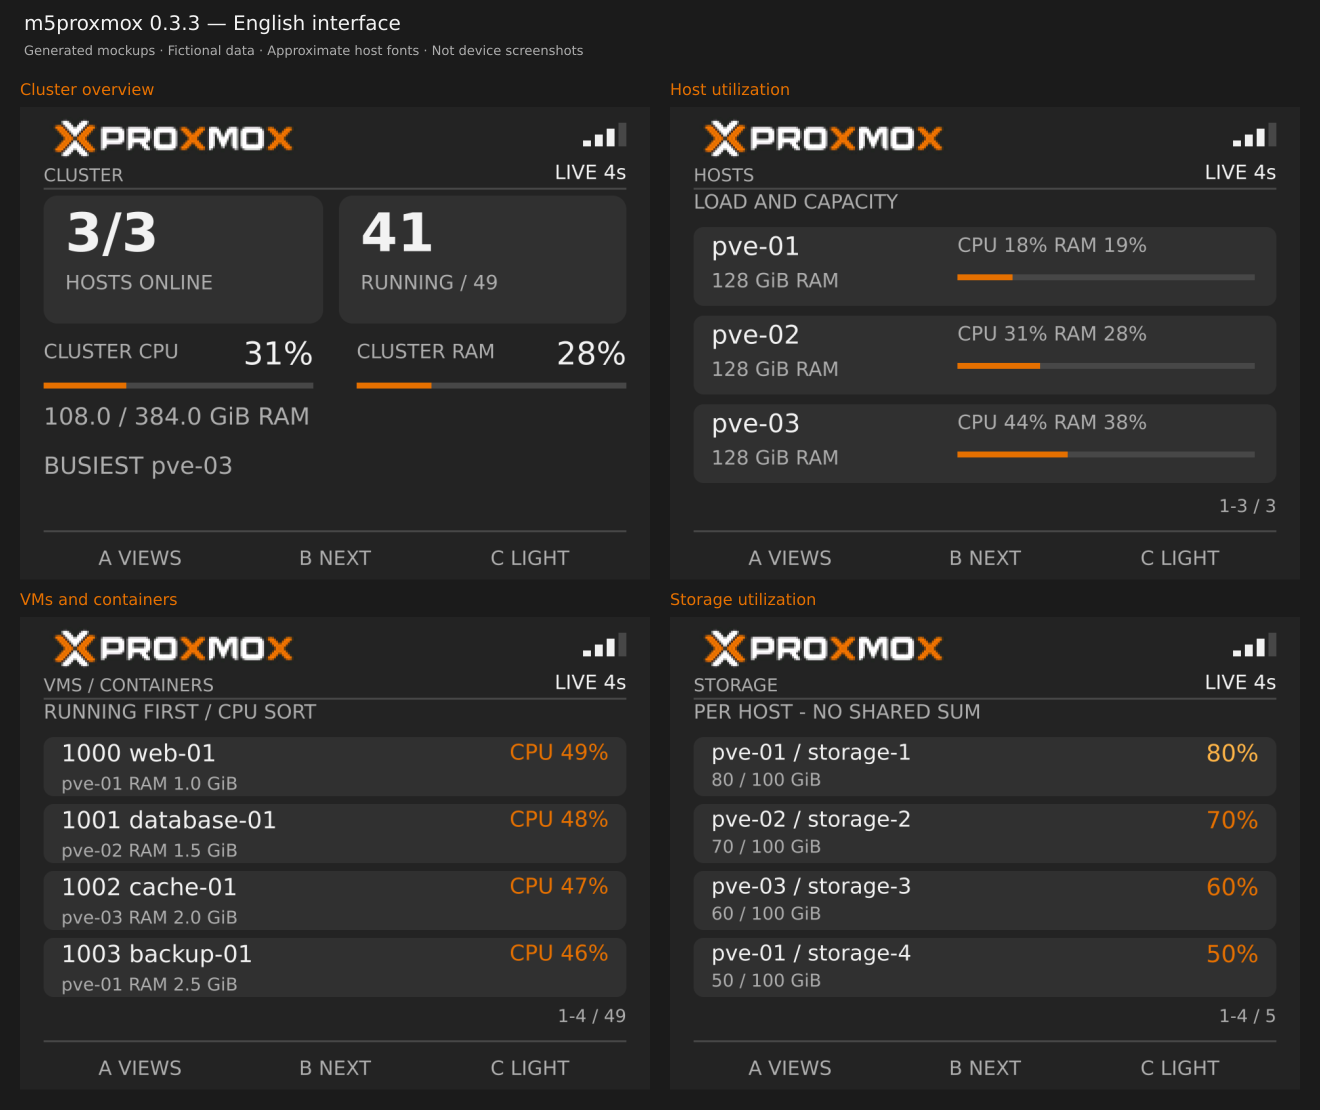
Button A changes the view, B moves through the entries and C changes brightness. The labels sit above the buttons. That's the whole navigation.
Knowing when the numbers are old
The device waits 15 seconds after a successful collection before polling again. If a request fails, it retries after 5 seconds and keeps the last values visible.
RETRY means the latest request failed but the previous sample is still recent. STALE appears once that sample is more than 45 seconds old, alongside its age and the latest error. Before the first successful collection, it waits rather than displaying invented measurements.
I want to be able to trust a glance at the screen. That includes knowing when it can't tell me anything current. The Wi-Fi bars only show signal strength; they don't mean the API is responding. Likewise, load colours aren't Proxmox alerts.
Look, don't touch
There are no start, stop or migration controls. For those, I use Proxmox.
The documented setup uses a dedicated user and a privilege-separated API token, both with the read-only PVEAuditor role. Certificate verification stays enabled. Credentials are stored in unencrypted device memory, so the box and its flash backups need to stay private.
Before putting one on your desk
You'll need the supported M5Stack, Wi-Fi access to your Proxmox endpoint, an API token and the right CA certificate. Installation and updates use USB. The repository has macOS, Windows and Linux guides, although the Windows and Linux flashing procedures haven't been physically validated yet.
This is still a DIY setup. The current firmware includes network and certificate assumptions specific to my cluster, which need adapting elsewhere. Version 0.3.3 supports up to 16 hosts, 160 guests and 64 storage entries, within its response-memory limits. On-device rendering, standalone cold starts and long-running network reliability still need validation for this release.
It won't replace alerts or historical monitoring. It also shares the network and API dependencies of the cluster it watches. What it gives me is simpler: a few useful numbers within sight, and a reason to open the full tools when something looks wrong.
The source, mockups and setup guides are in the m5proxmox repository. It's an unofficial project, not a Proxmox product.