Grafana could tell me that something had changed. Finding out why still meant opening terminals, switching between interfaces and trying to line up timestamps. HAProxy had one piece of the story, Kubernetes another, and the backup server its own version of events.
I installed Graylog to bring those pieces together. Not to replace Grafana, and not to turn the homelab into a pretend enterprise SOC. The goal was simpler: make infrastructure events searchable in one place, then build useful operational checks on top.
Installing the stack
The starting point is a dedicated Proxmox VM with 4 vCPUs, 16 GiB of RAM and a 300 GiB virtual disk on NFS-backed storage. It runs Ubuntu 26.04.1 LTS. This is a single-node deployment, not a highly available logging cluster; the hypervisor, NAS and network remain shared dependencies.
The installed stack uses Docker Compose with official images pinned by digest:
- Graylog Open 7.2.1 handles ingestion, processing, streams, searches, dashboards and event definitions.
- Graylog Data Node manages the search backend, with OpenSearch 3.7.0 embedded in this installation.
- MongoDB 7.0.45 stores Graylog configuration and metadata. It is not where the indexed log messages live.
Keeping those roles separate makes the installation easier to understand and recover. Graylog is the application, OpenSearch holds the searchable message data, and MongoDB holds the configuration that makes the application useful.
- Prepare the VM and validate dependency compatibility.
- Configure persistent volumes and resource limits.
- Start the Compose stack and complete the Data Node bootstrap.
- Send a test message and verify that it is searchable.
- Test recovery before connecting real sources.
One dependency caught me early. MongoDB 8.0 refused the host kernel because of a known compatibility issue. Containers share the host kernel, so moving a process into Docker does not make that problem disappear.
I used the compatible MongoDB 7.0 branch and tested the resulting stack rather than bypassing the check. These are the versions installed here, not a universal recipe for a new deployment.
Secure access and buffered collection
The web interface sits behind a local HTTPS reverse proxy. MongoDB and the search backend stay on the private Docker network, while the Graylog application endpoint is bound to loopback behind that proxy. Nothing was opened to the public internet to receive logs.
Collection uses dedicated inputs and streams. Depending on the source, that means verified TLS syslog, mutually authenticated GELF or Beats, or a local API collector forwarding to an authenticated loopback input. Separating the paths makes it much easier to understand what stopped working without disturbing everything else.
I keep local logs and use persistent queues or checkpoints where supported. That buys recovery time during an interruption; it does not promise unlimited buffering or exactly-once delivery. Queue exhaustion, source rotation and crashes at the wrong boundary can still lose or duplicate records.
What I collect, and why
HAProxy: the front door
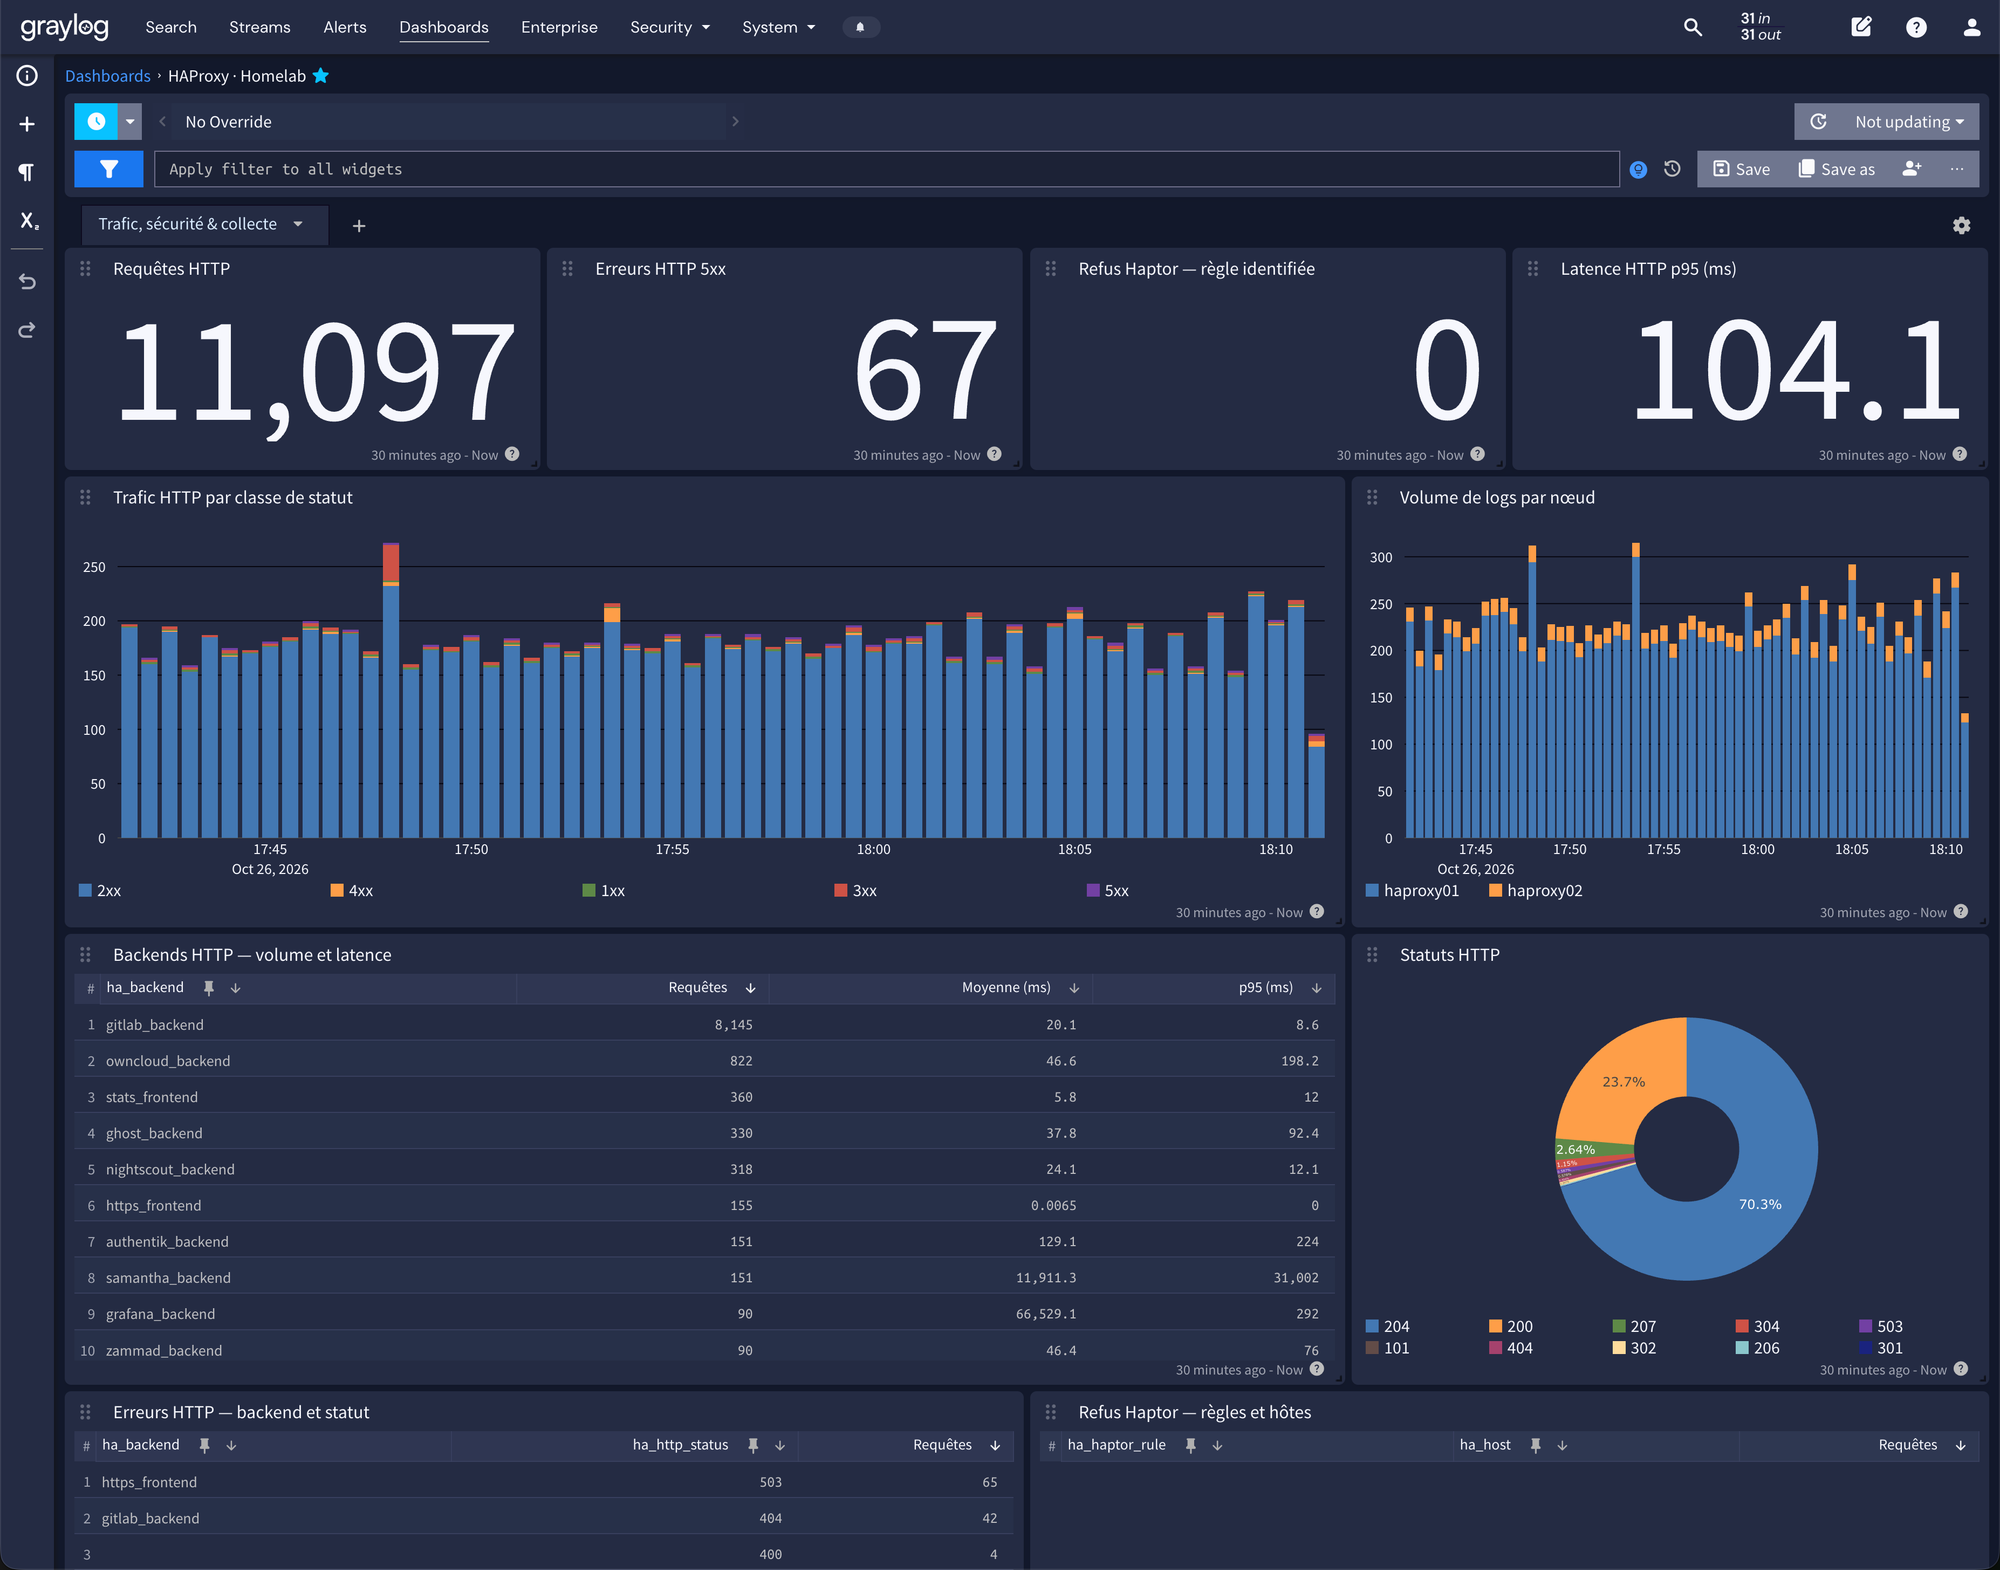
HAProxy was the first real source. Since retiring the NetScaler SDX 11500, HAProxy has become an essential part of the infrastructure. Its logs are a good place to start when a site is slow, a backend becomes unavailable or a TLS connection fails.
Both proxies forward their logs while retaining the local copies. Parsing separates HTTP traffic, TCP traffic and TLS failures, with numeric fields available for aggregation. A dedicated dashboard makes it possible to move from a broad symptom to the relevant records without SSHing into both machines.
Not every unusual line fits a parser. Unknown formats remain visible as partial records instead of being quietly turned into reassuring statistics.
Kubernetes: container logs and Events
On the seven-node Talos cluster, Fluent Bit runs as a DaemonSet and reads container stdout and stderr from CRI log files. It attaches node, namespace, pod and container context, then forwards the records over mutual TLS. The deployment is managed through GitLab and FluxCD, alongside the rest of the cluster configuration.
A separate collector reads Kubernetes Events. Container logs help explain application behavior; Events help explain scheduling failures, image pulls and other orchestration problems. Collecting one does not automatically collect the other.
There are useful limits to remember. Stderr is not automatically an application error, and repeated Kubernetes Events may update an existing aggregated object rather than describe separate failures. Container logs, Events, Talos system logs and API audit are now collected through distinct paths because they answer different questions.
Backups, storage and authentication
Proxmox and Proxmox Backup Server contribute journals and task information through their APIs. TrueNAS contributes existing alerts, selected task observations and pool-state changes. The aim is to answer practical questions: did a backup finish successfully, did a pool become unhealthy, and did the source stop reporting?
Those are different conditions. A capacity warning is not proof of a degraded pool. A running backup is not a failed backup. A historical observation is not a live inventory.
For identities, I collect selected authentication records from fourteen Linux systems and existing Windows Security events from the domain controller. SSH, sudo, PAM and Windows logon events become easier to investigate together. I did not silently expand Windows audit policy or deploy process-wide surveillance to make the dashboard look busier.
Data minimization matters here. Linux sudo arguments are removed before forwarding; the actor, target and executable remain. An invocation record still does not prove that the command completed successfully.
Network, DNS, databases and GitLab
The next sources fill operational gaps rather than collect everything available. UniFi contributes selected infrastructure, WAN and security events plus device-state observations. DNS collection focuses on AdGuard and Unbound diagnostics, not a history of every name somebody resolves.
For the database host, GitLab and runners, the new path forwards selected component states and categorized diagnostics. It deliberately excludes SQL text and raw CI traces. Detailed originals remain on their source systems when a deeper investigation is needed.
This is already useful beyond security. For example, PostgreSQL collation-version warnings can be surfaced as a distinct diagnostic category without copying application queries into the central log platform. Finding that warning is not the same as fixing it, and collection does not trigger database maintenance.
Talos: a separate view of the operating system
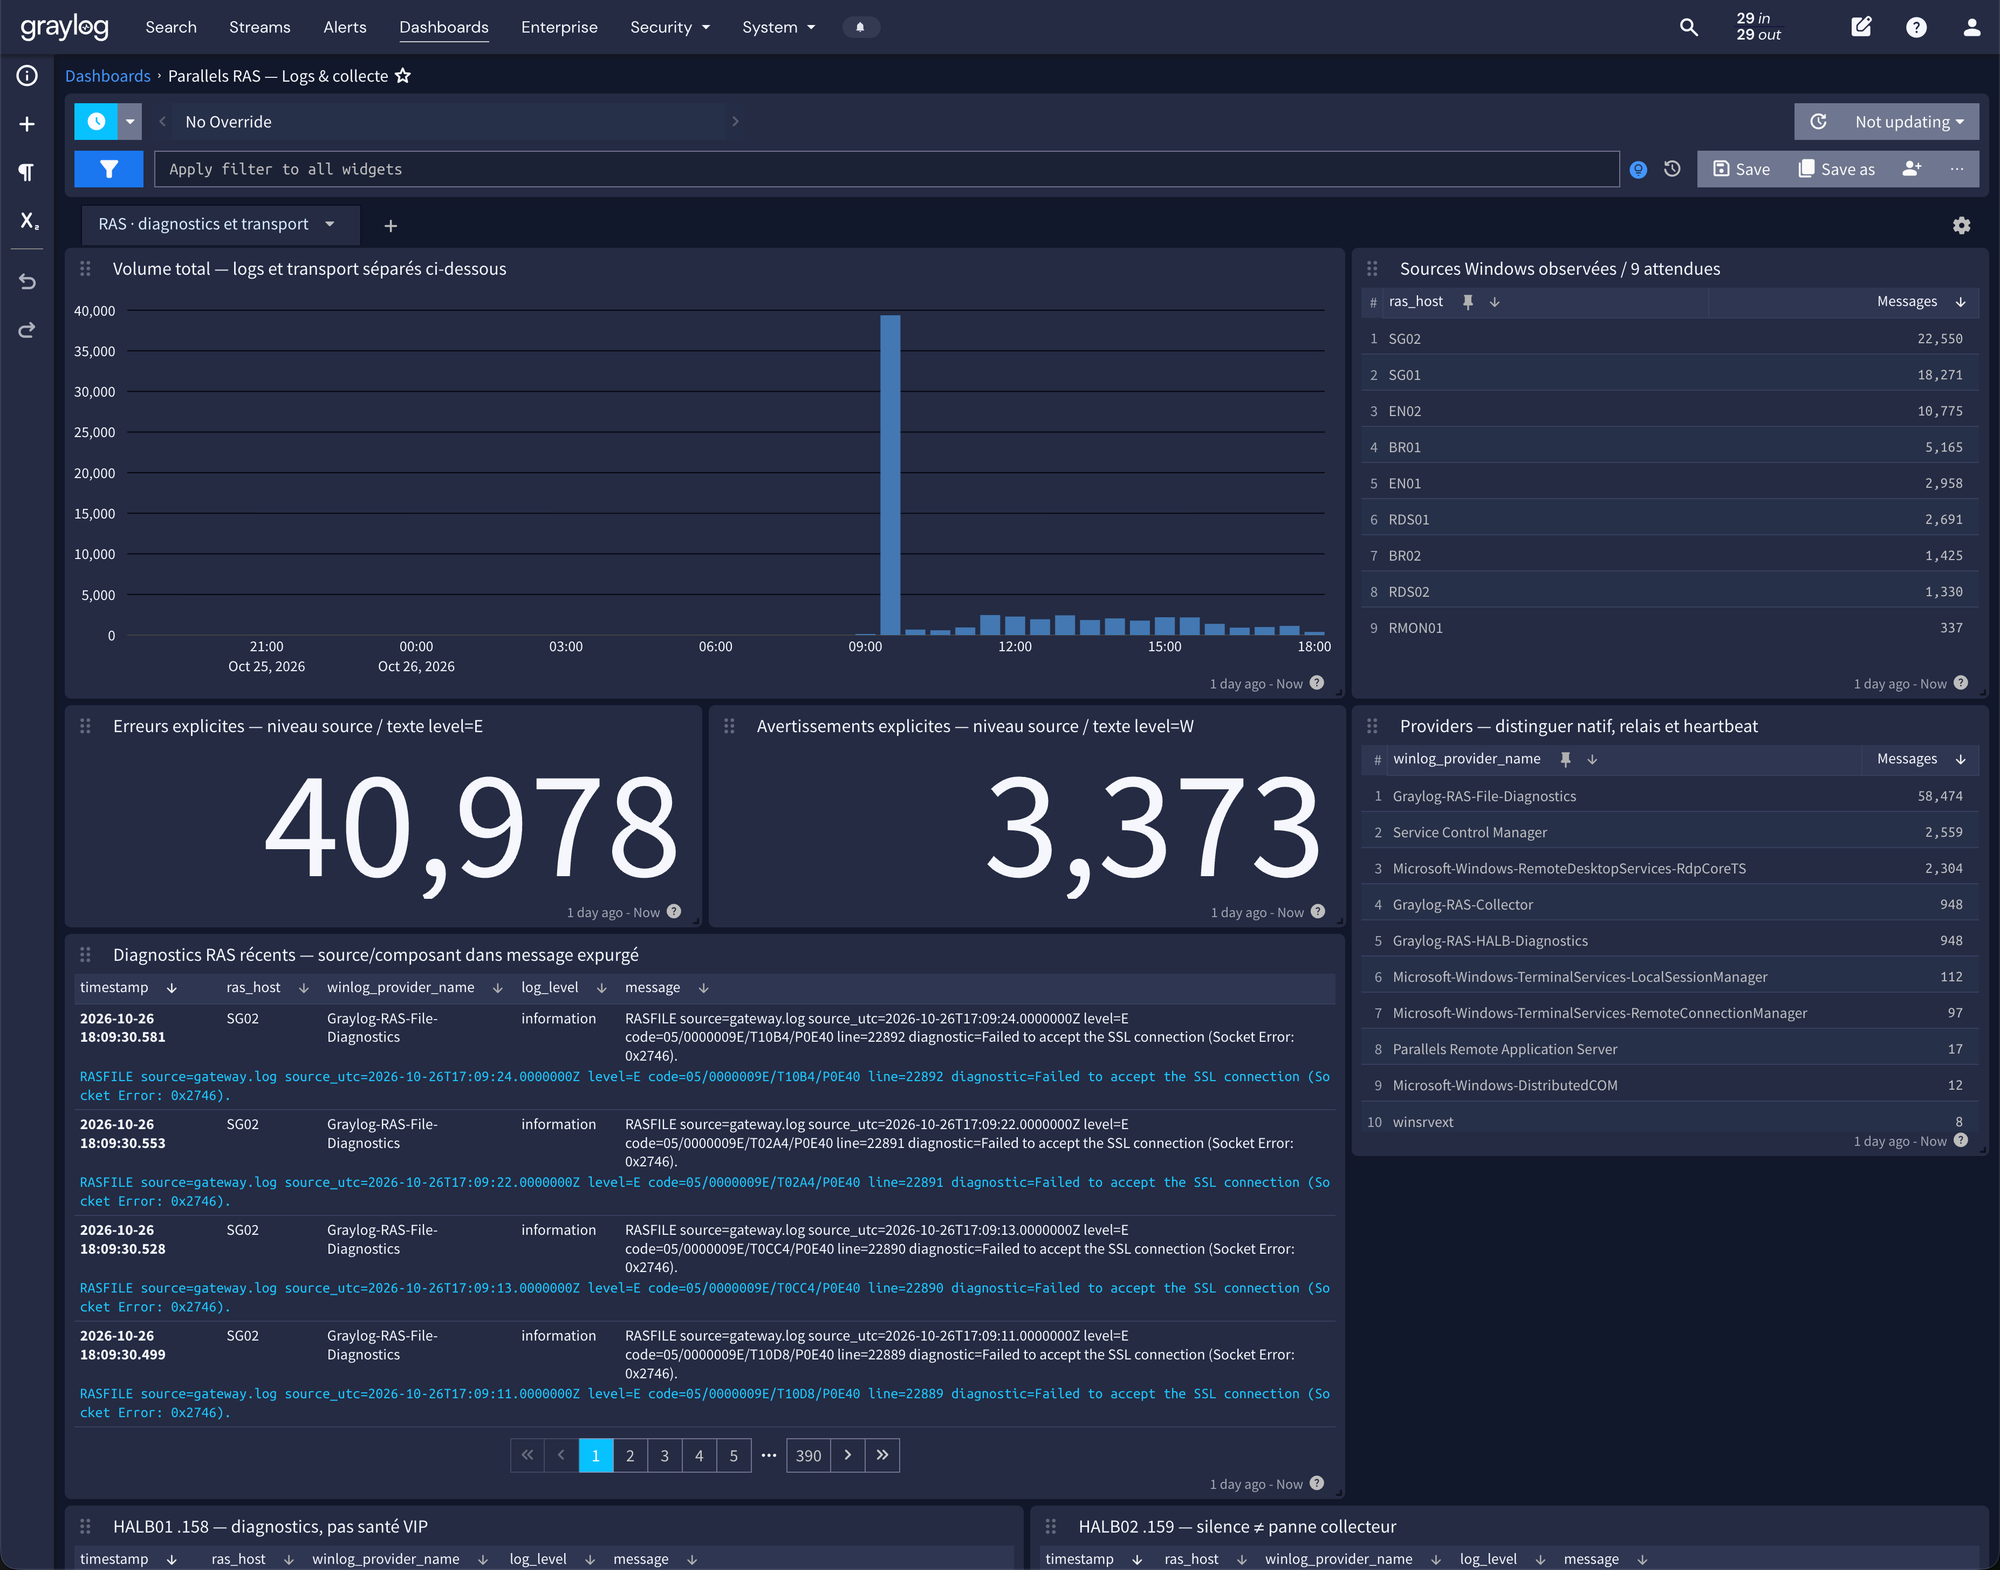
Container logs do not explain everything happening underneath the workloads. Dedicated collectors now read selected Talos system logs on all seven nodes, including kubelet, containerd, kernel and machine services. They have their own persistent cursors, bounded buffers and collection-health checks.
Keeping this path separate became a practical lesson during rollout. An initial shared-agent extension crashed two collectors. I restored the original container-log path and moved Talos collection into an independent DaemonSet. The final deployment was validated on all seven nodes, but I cannot claim complete log coverage during that incident. Preserving old buffers is not the same as proving that every record was replayed.
Authentik: identity events with useful boundaries
Authentik audit events were already arriving through the Kubernetes log path. They now have dedicated normalization and detections for bursts of failed logins, explicit MFA failures and selected sensitive administrative actions. New normalized audit messages retain selected fields instead of copying arbitrary HTTP context or secrets. Historical records have not been rewritten.
The distinction between an unknown MFA state and a confirmed MFA failure matters. So does the difference between a legitimate administrative change and an attack. The rules provide review signals, not automatic verdicts or account blocking.
Kubernetes audit and RBAC: a write is not necessarily a change
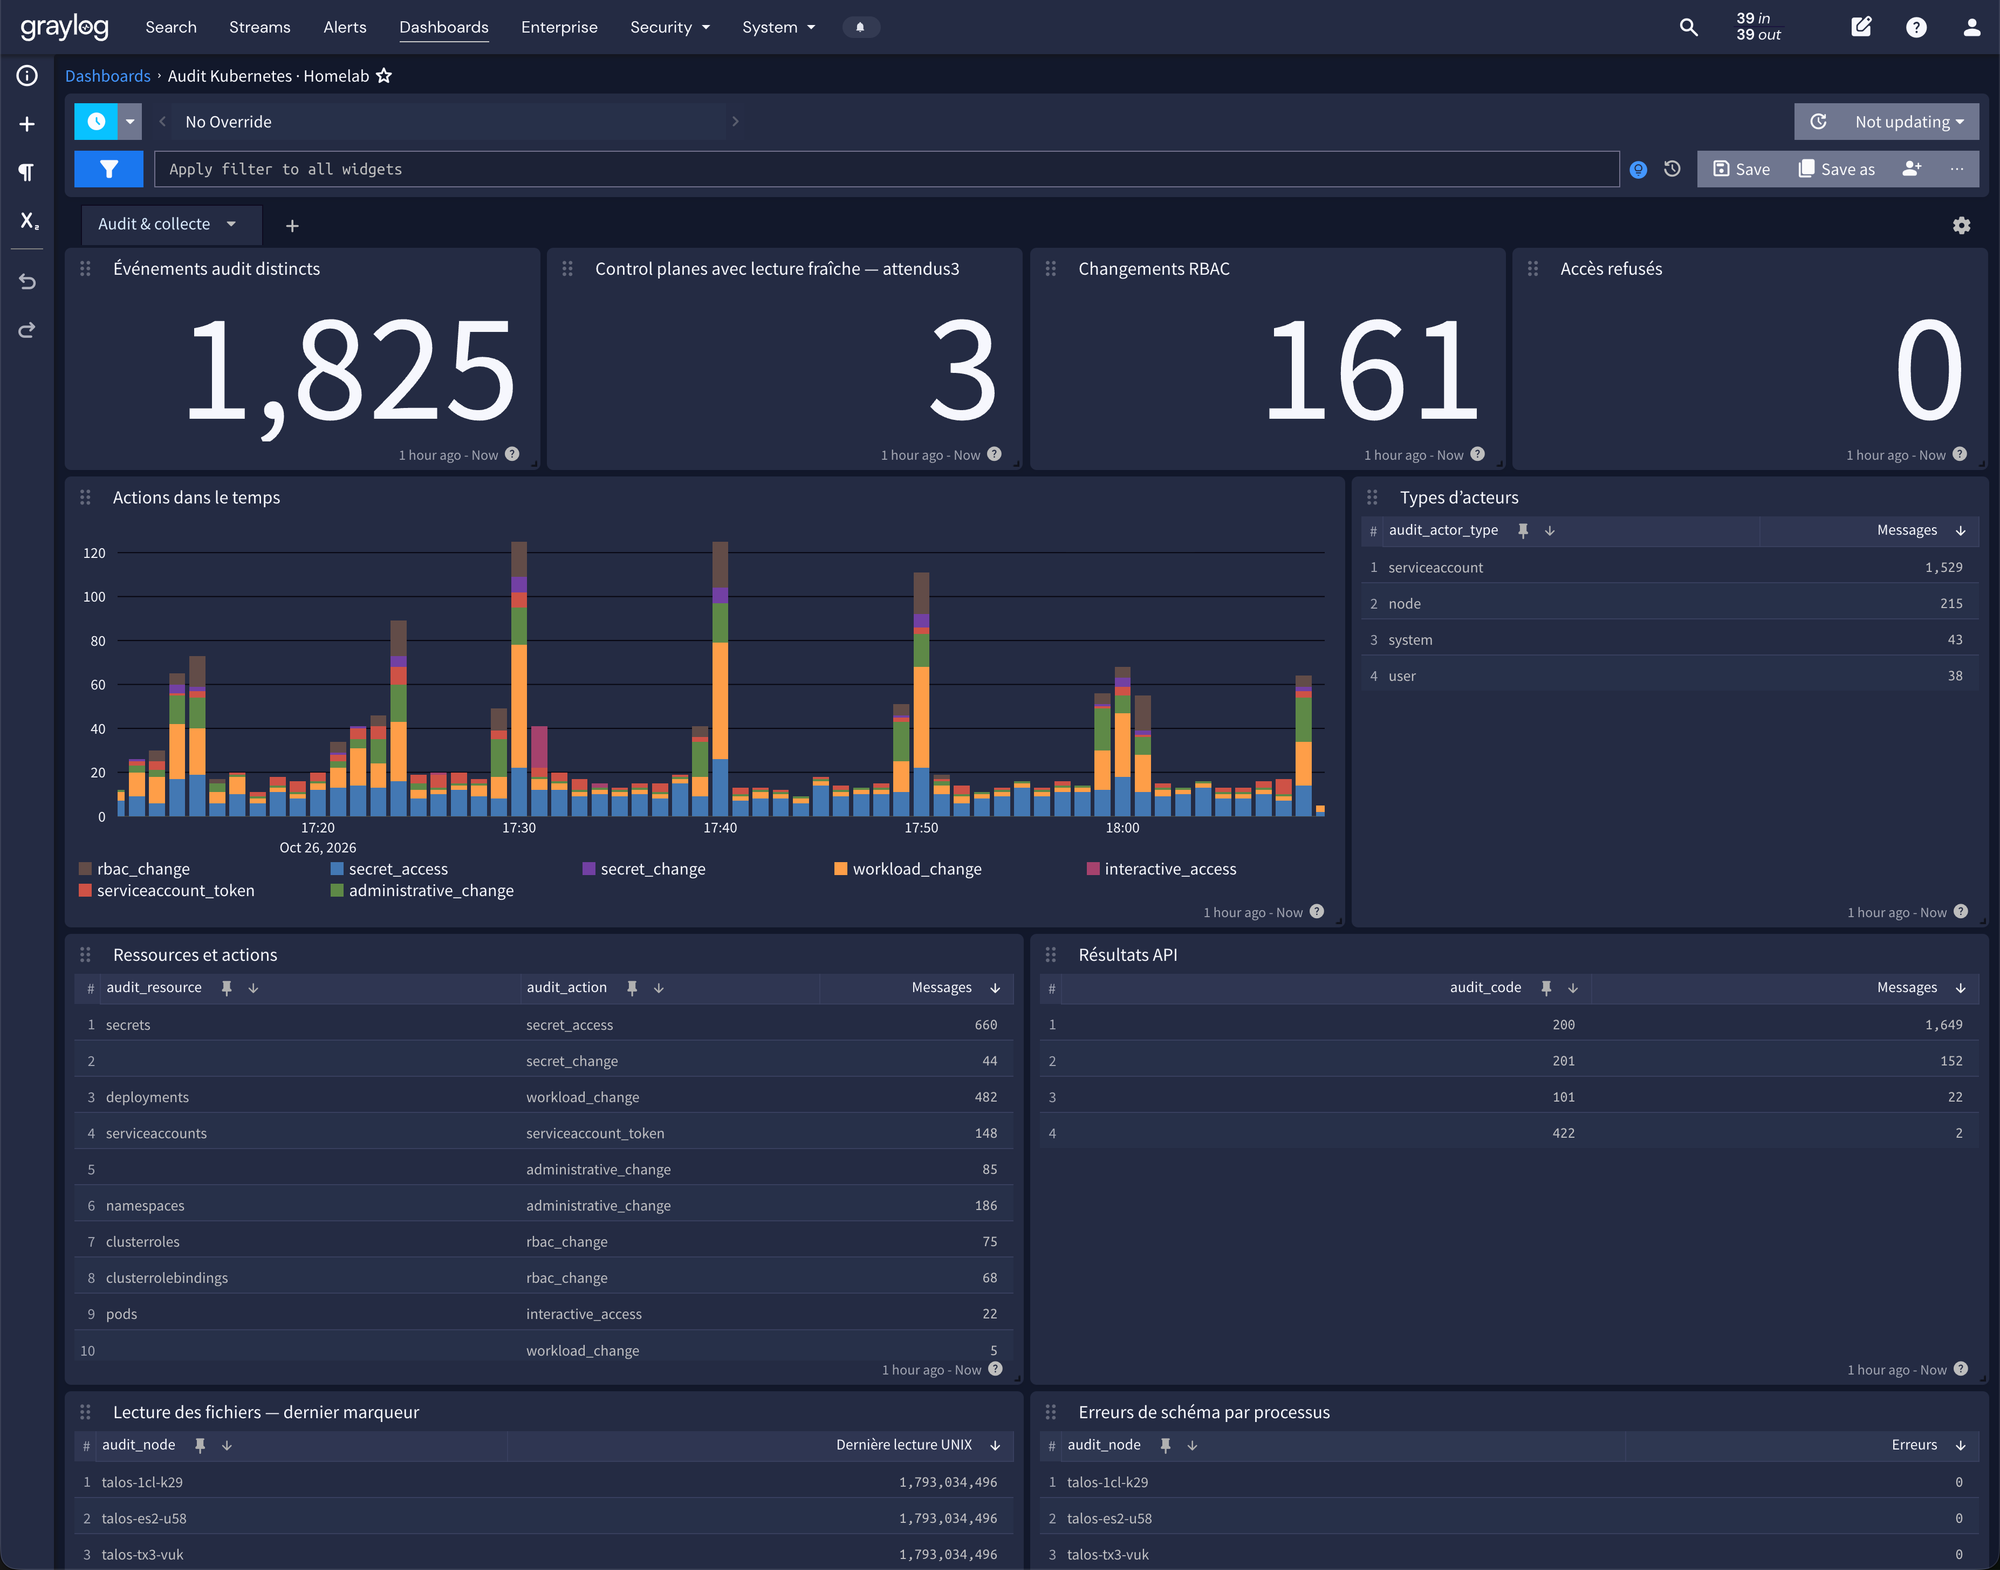
A third, independent collection path now reads the existing Metadata-level Kubernetes API audit logs on the three control-plane nodes. It selects RBAC writes, administrative and interactive operations, and access denials without forwarding request bodies, Secret contents, command-bearing request URLs or raw audit records. The audit policy itself was not expanded for this work.
Detections cover successful RBAC writes, selected sensitive operations by user-class actors, and bursts of denied requests. Secret reads remain searchable without producing a Telegram message for every ordinary read. An audit record describes an operation; Metadata-level logging does not reveal the exact permission rules submitted or the content of an interactive session.
This exposed a familiar GitOps problem: Flux can PATCH an RBAC object during reconciliation without changing its meaningful configuration. Notifying every successful write creates noise, but blindly ignoring Flux would hide real changes.
A dedicated read-only LIST/WATCH observer now compares Role, ClusterRole, RoleBinding and ClusterRoleBinding configurations before and after changes. It tracks rules, subjects, role references and aggregation-related fields while ignoring annotation-only changes and ordering. Private before/after evidence is retained for 48 hours; Graylog receives summaries and hashes rather than complete policies.
Only successful PATCH operations from the specific Flux controller can become silent, and only when continuous, fresh observer coverage makes that decision verifiable. Configuration differences are notified separately, including changes later reverted. Other actors, failed operations and unknown or gapped coverage stay visible. This compares configuration, not every identity's effective privileges, and the first baseline proves nothing about earlier history.
Alerts and collection health
Telegram notifications are now active in the dedicated homelab topic. Operational monitoring covers selected failed backup or maintenance tasks, unhealthy pools, missing collectors and Graylog health. Persistent incident state, an outbox and two-observation confirmation reduce duplicate notifications and transient noise; operational recovery messages follow the same lifecycle.
Security detections add SSH and Windows failed-logon bursts, Windows account creation and additions to selected privileged groups, Authentik identity events, and targeted Kubernetes audit signals. Initial burst thresholds include ten SSH failures in five minutes, ten distinct Windows failed-logon records in five minutes, and three explicit Authentik MFA failures in ten minutes. These are starting thresholds to tune, not evidence of an attack by themselves.
Security messages use persistent deduplication and cooldowns where appropriate. An isolated security event does not receive a misleading “back to normal” simply because no new event followed. Telegram receives concise rule, time and investigation context rather than raw logs, credentials or complete RBAC policies. No automatic blocking or permission changes are performed.
Heartbeats make silence visible, but their meaning is narrow. A live agent does not prove that every application or every forwarding path on its host is healthy.
Graylog cannot reliably report its own disappearance from inside the VM. An independent observer checks it from another machine, including the stack, search health, recent searchable data, disk space and journal pressure, and reports to Uptime Kuma and the operational notification path. The notifier workers depend on the automation host, OpenClaw and Telegram: this is independent of the Graylog VM, not an out-of-band channel independent of the whole homelab.
Retention, capacity and recovery
The current policy retains messages for roughly 7 to 8 days, depending on daily index rotation. The Graylog journal has separate size and age limits; it is a buffer, not a backup.
The first completed 24-hour observation campaign recorded about 1.35 GB per day of net index growth. That measurement predates the expanded Talos and Kubernetes audit collection and must not be presented as its current ingestion rate. A new 24-hour observation campaign is running, with its report scheduled for 25 October; its full-period result is not available yet. Net index growth is affected by merges, and five-minute samples can miss short peaks. Journal space, operating-system files and free-space margin still need separate allowance.
Before onboarding the sources, I tested a coherent application backup by restoring it into an isolated stack and finding the indexed test message again. The Graylog VM is now deliberately excluded from PBS backups: its retained log data is treated as non-critical in this homelab. The earlier statement that it belongs to the daily backup job is no longer the policy, and the obsolete backup-age check for this VM has been removed. Failed backups elsewhere remain monitored.
This is an explicit availability and data-loss trade-off, not a recovery guarantee or a recommendation for critical production logging. The initial isolated restore test remains historical evidence; it does not prove recovery of the expanded current deployment. Configuration and collector state exports must not be confused with a current full-data backup.
What changes in daily use
The biggest improvement is fewer disconnected investigations. When a service misbehaves, I can compare proxy records, container messages, orchestration Events and infrastructure tasks over the same period. Grafana still answers the metrics questions. Graylog adds the event trail.
There is no claim of complete coverage, automatic remediation or a finished SOC here. What I have is a practical logging foundation that now connects operational monitoring, identity signals and Kubernetes change review. Keeping the collection healthy and the alerts explainable matters more than adding another noisy rule.