I opened my Homelab page and realised I would have to explain which bits to ignore before anyone could use it. The rack still looked familiar. The software inside it had moved on. Time to redraw the map.
I have updated the Homelab page with an October 2026 snapshot: the current Proxmox inventory, the Talos Kubernetes cluster, storage and backup relationships, routing, and the services behind it all. Instead of squeezing every detail into one enormous drawing, there are now six views.
There is quite a lot on those drawings, so let me walk through them. I will start with the machines, follow the storage and network paths, then get to the applications. Along the way, there are a few arrows worth explaining and a few numbers that look contradictory until you know what they count.
All addresses and service URLs in the public diagrams are fictional examples. The topology and component names are retained, but the example subnets are not a network configuration to copy. The inventory was captured on 17 October 2026, with PBS01's hosting clarified on 18 October.
What actually changed?
The biggest change is that the applications have moved from Docker Swarm to Kubernetes on Talos. Proxmox is still underneath, doing the VM work. Above it, there are now seven Talos nodes: three control planes and four workers. Same lab, rather different software stack.
Another major change deserves just as much space: the NetScaler SDX 11500 has been retired and replaced by HAProxy. This was not just a change of reverse proxy. HAProxy is now an essential part of the infrastructure, sitting on the access path to the services I use every day. The pair handles TLS and hostname-based routing, while its BGP integration makes the shared virtual address reachable through the network. It is no longer a supporting box in the diagram; it is one of the components the rest of the platform depends on.
The full story starts with the NetScaler-to-HAProxy migration. The later move from Keepalived to BGP explains how the routing design evolved; read its March update too, which describes the shift towards deterministic active/passive routing.
The old network view also needed more than a reverse-proxy box and a hopeful arrow. HAProxy, MetalLB and BGP each have a job here. The new drawing follows the request far enough to show which component is doing what.
Storage is split out into its own view, because a datastore, a persistent volume, a replica and a backup are four different things. One detail is now explicit throughout the updated drawings: PBS01 runs as a virtual machine hosted on TrueNAS02. Older articles describing a bare-metal or container-based PBS arrangement document earlier versions of the lab, not this one.
1. The rack is only the beginning

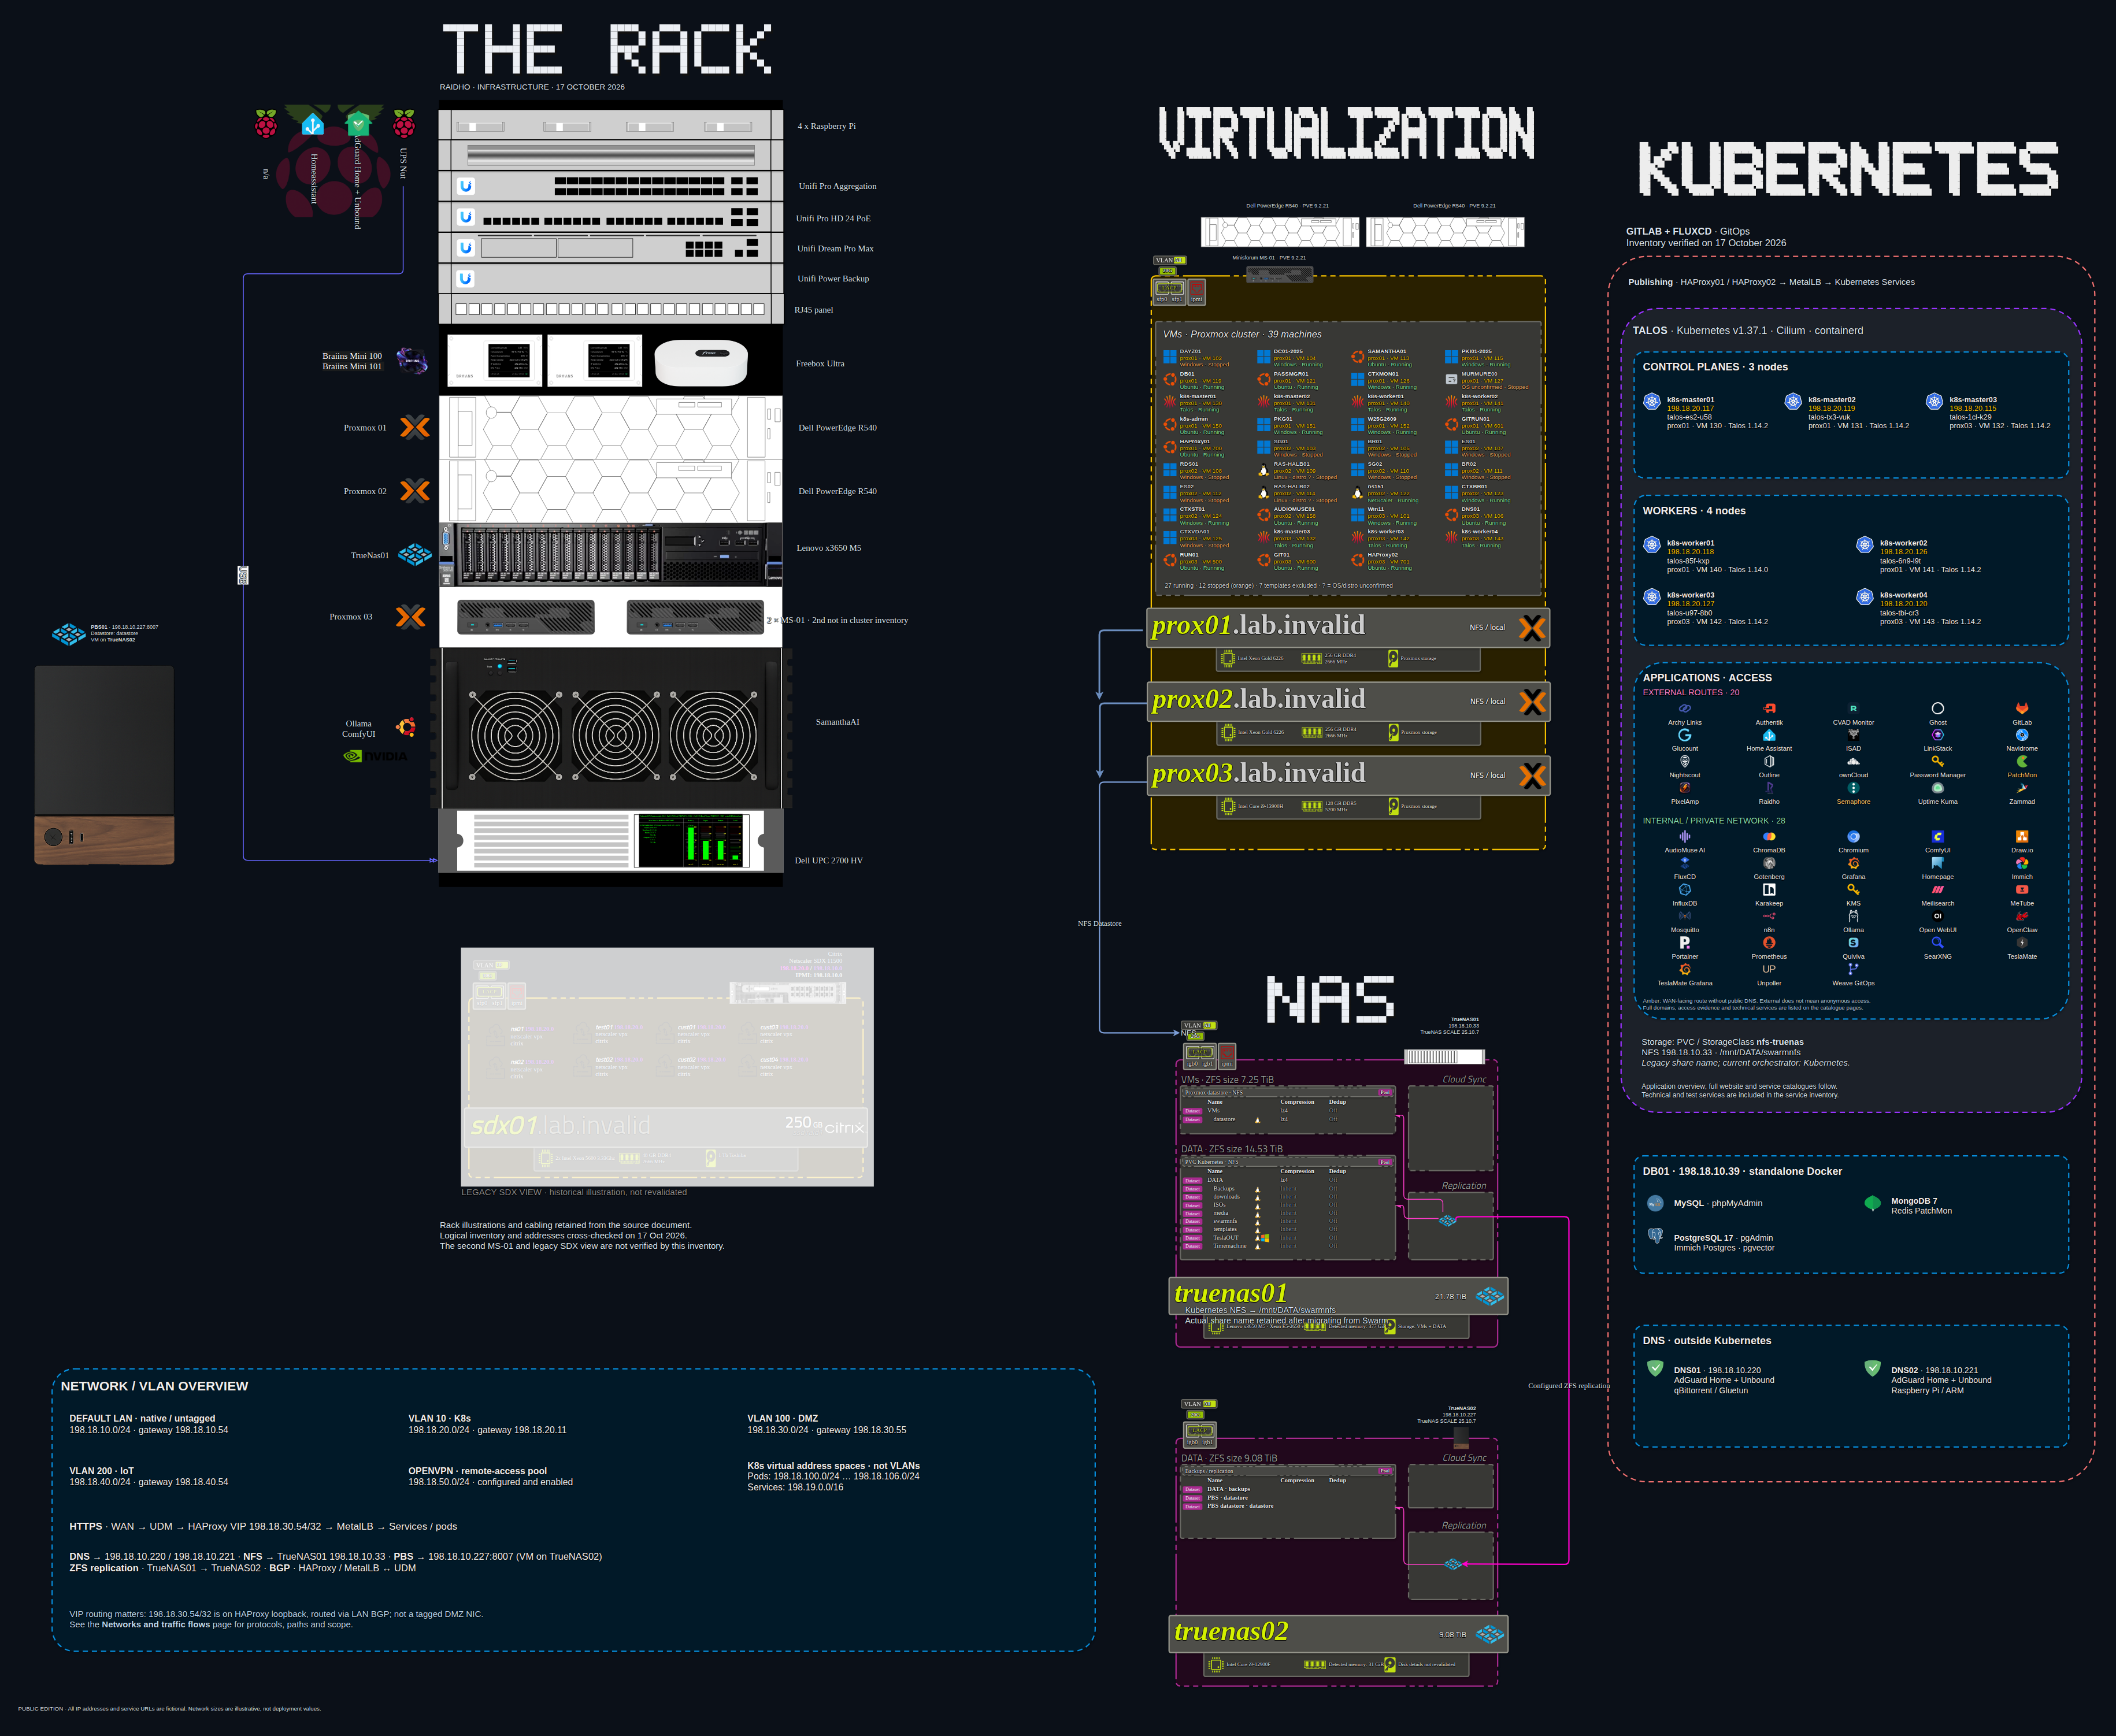
Start on the left with the actual rack, then move across to the VMs and storage. Kubernetes gets its own section on the right. It is the closest thing to a family photo of the lab, including a few relatives who are no longer doing much.
The current compute inventory contains three Proxmox hosts. The rack illustration includes two Dell PowerEdge R540 systems and Minisforum MS-01 hardware. It also retains historical hardware detail, including a second MS-01 that was not confirmed in the reviewed cluster inventory. A box drawn in the rack is not automatically an active cluster member.
For the original hardware choices and how the rack came together, the first Homelab hardware post is the starting point. It is the earlier build story, not the current inventory.
Proxmox VE provides the VM layer. That is where ordinary Windows and Linux guests sit alongside the VMs used for Kubernetes. The snapshot lists 39 guests, including 12 stopped VMs. Keeping those stopped machines visible makes the drawing an inventory rather than a screenshot of today's running processes.
Talos Linux is the operating system of the Kubernetes nodes. It is built to run Kubernetes and is managed through its API rather than treated as a general-purpose Linux server to customise over SSH. The three control planes run the cluster's control-plane services; the four workers provide the application execution layer. Three control planes give the distributed state store a quorum arrangement, but the number alone does not establish resilience against every physical failure.
containerd runs the containers. Cilium supplies cluster networking, with the pod-network view documenting VXLAN between nodes. MetalLB provides LoadBalancer service addresses and advertises the relevant routes. These components cooperate, but they do not do the same job.
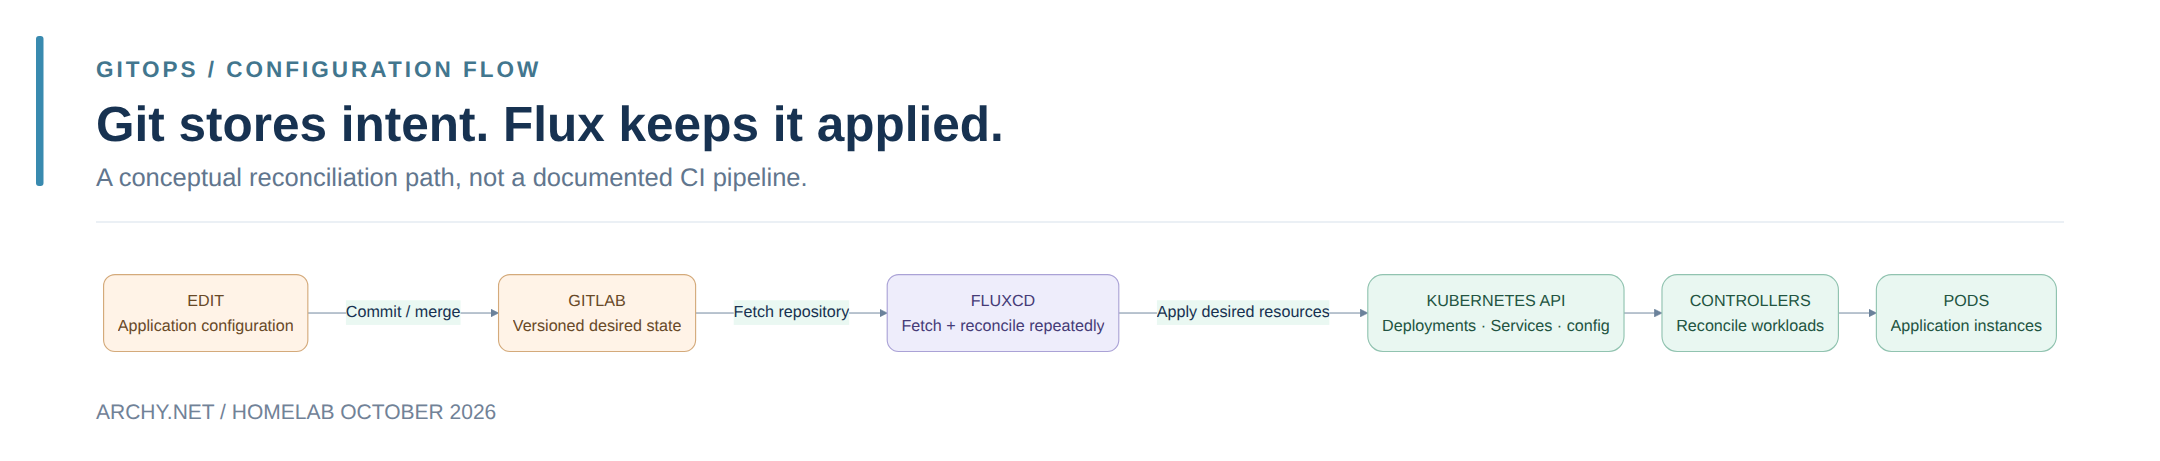
GitLab and FluxCD form the GitOps side of the platform: Git holds the intended configuration, and Flux reconciles the cluster towards it. That is a different responsibility from scheduling pods or carrying their network traffic. The diagram is easier to read once those jobs stop being one big “Kubernetes” box.
GitLab holds the intended state; Flux keeps checking it and applying the declared resources. That does not mean every commit rebuilds an image, or that GitLab directly pushes pods into the cluster. Image building and delivery are separate concerns. The arrows here explain reconciliation, not an unverified CI pipeline.
The Docker Swarm to Talos migration article goes into the original Cilium, MetalLB, NFS and Flux setup. Its versions and migration-stage inventory belong to March 2026; the October diagrams above are the current snapshot.
The application panel then answers a more human question: what is all this running? There are 48 applications in the overview, separated by access category. The infrastructure exists to deliver those services, not to win a competition for the longest YAML file.
2. Storage, copies and backups are not the same thing
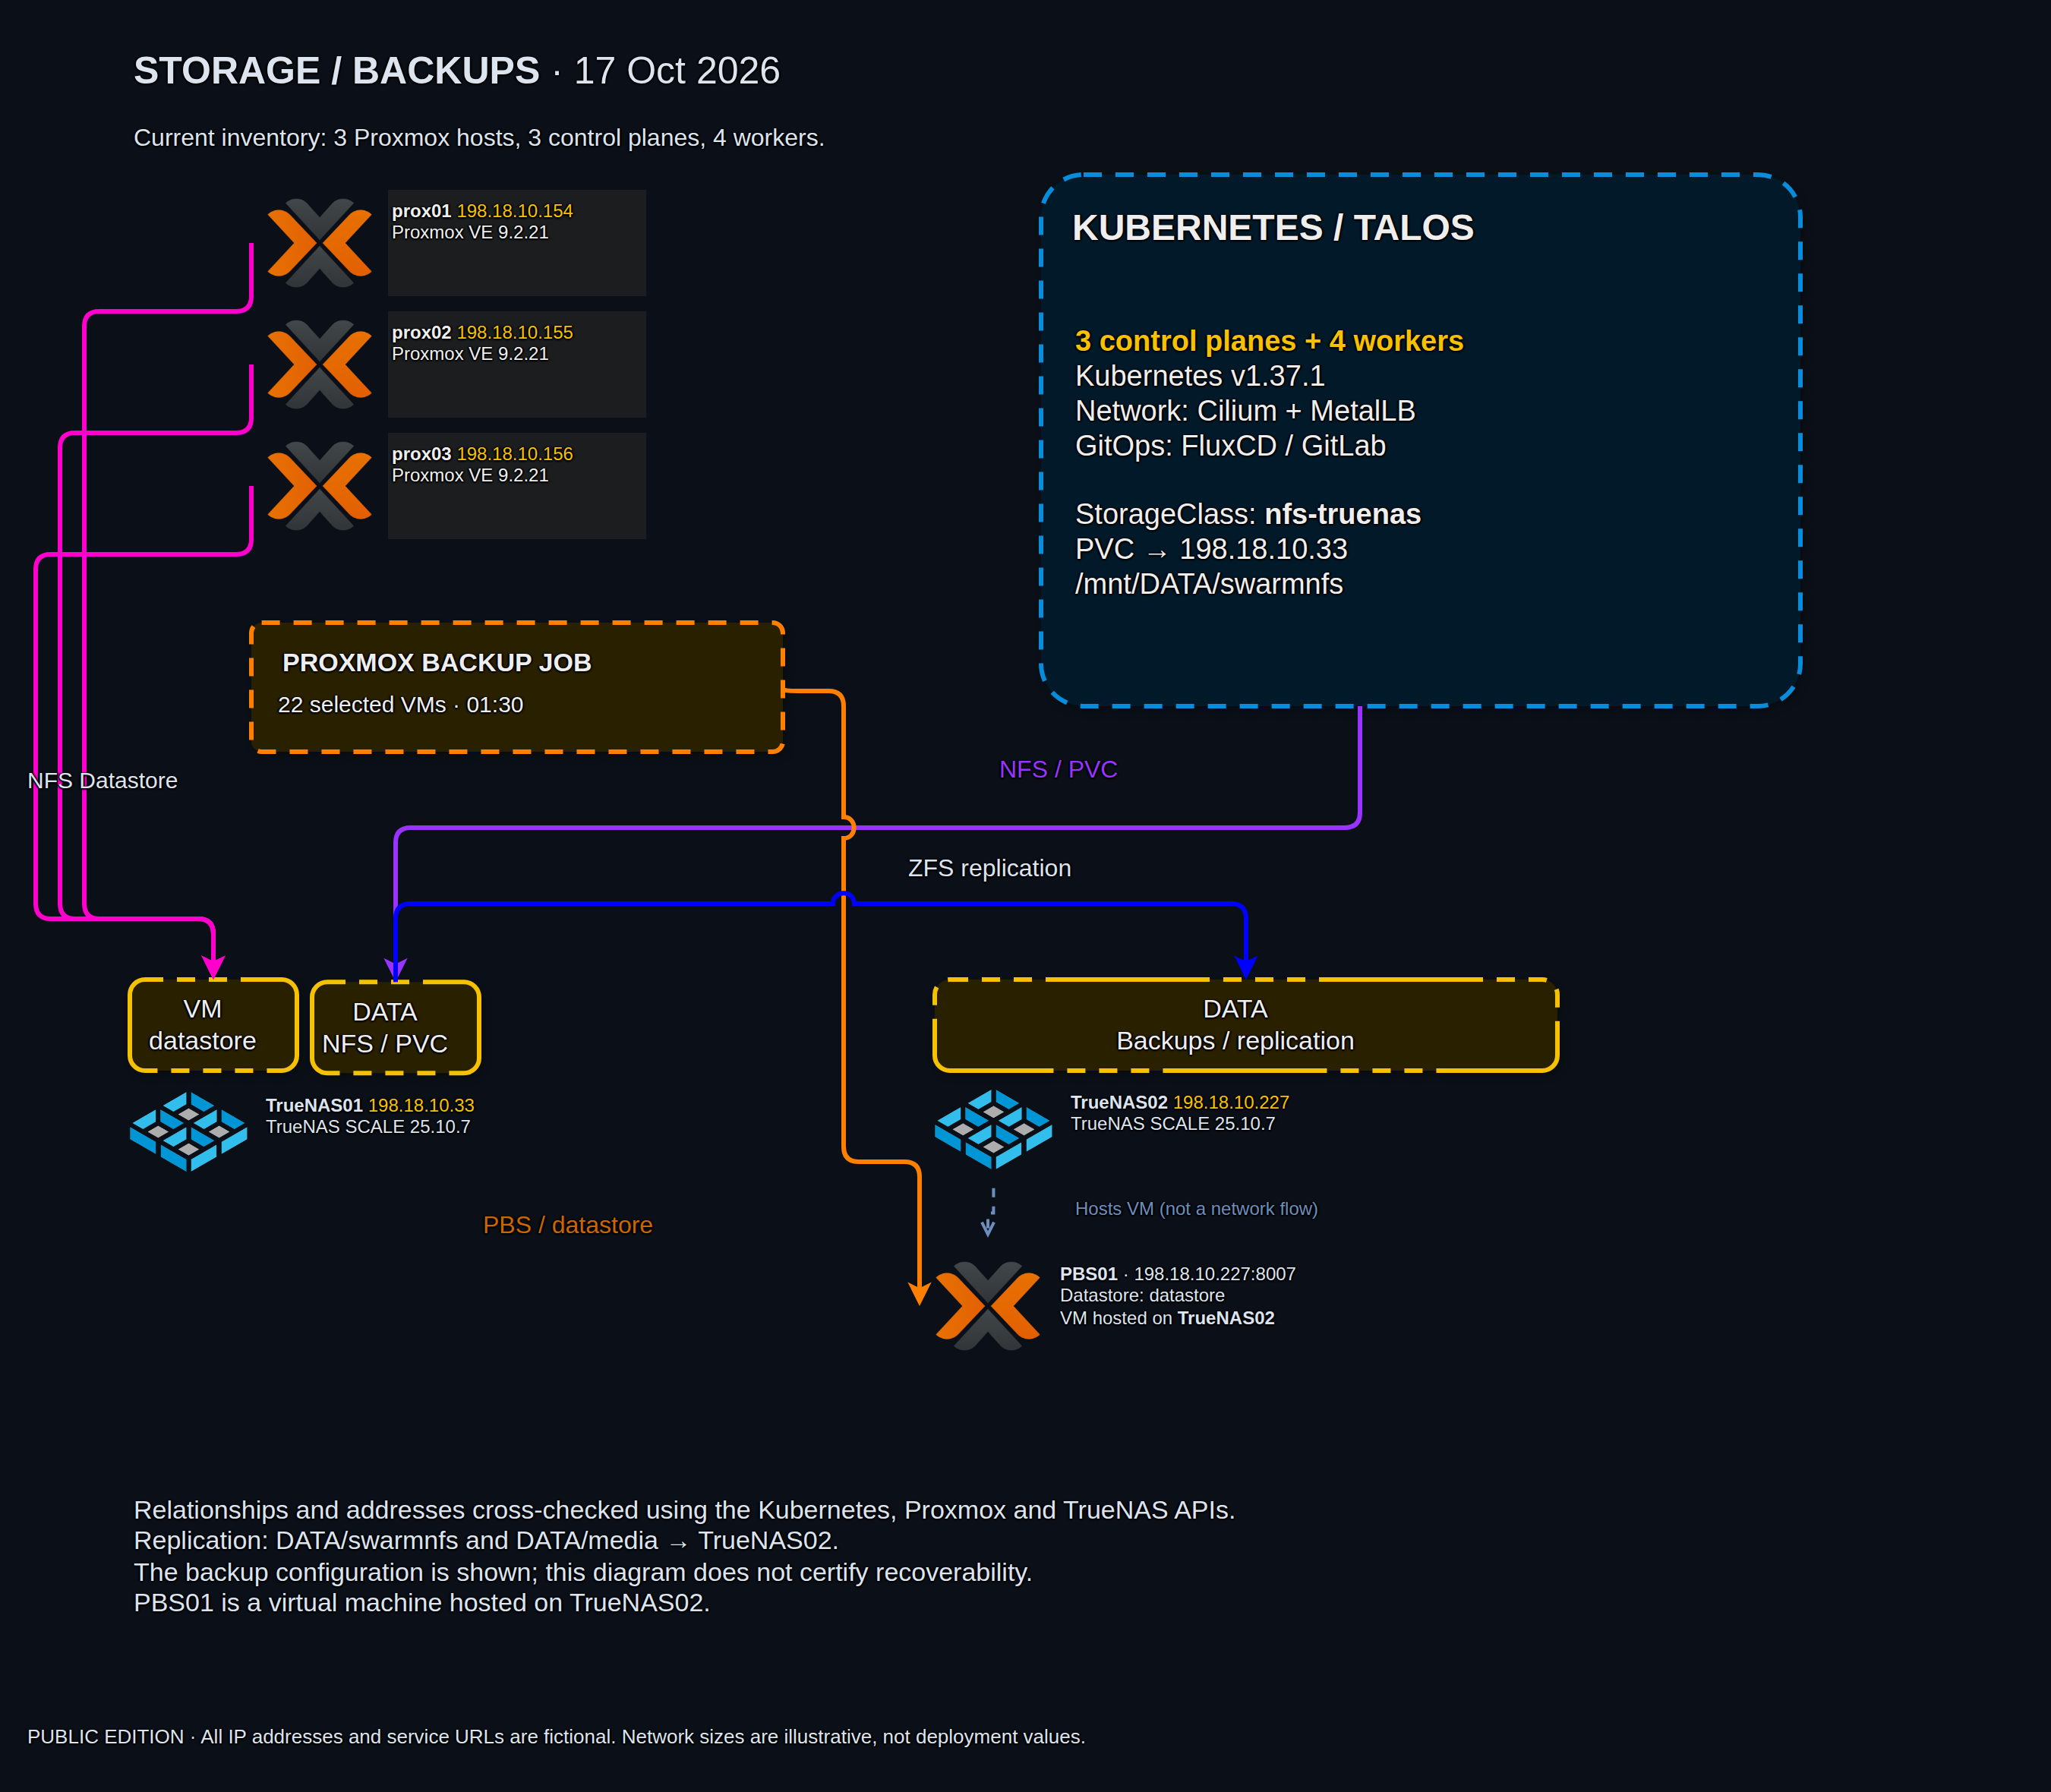
This is the drawing where the arrows need the most care. Not everything pointing at a second NAS is a backup, and not every storage connection belongs to the same layer.
- TrueNAS01 supplies NFS storage used by Proxmox and the Kubernetes workloads shown in the diagram.
- Proxmox NFS datastores hold VM storage. That connection belongs to the hypervisor layer.
- Kubernetes persistent volumes use the
nfs-truenasStorageClass and the NFS-backed data share. That connection belongs to application persistence. - TrueNAS02 receives the documented ZFS replication and hosts the PBS01 virtual machine.
- Proxmox Backup Server is the configured VM backup target, separate in purpose from the replicated datasets.
The Kubernetes share still carries the old swarmnfs name. That is an inherited storage path, not evidence that the applications shown there are still running in Swarm. Infrastructure has a habit of keeping its old street signs after the residents have moved.
Follow the replication arrows from TrueNAS01 to TrueNAS02 for the selected data datasets. Follow the backup arrow from the Proxmox job to PBS01 for VM backups. The captured backup job selects 22 VMs; it should not be read as “all 39 VMs are backed up.”
The short dashed relationship between TrueNAS02 and PBS01 means hosts this VM. It is not another network transfer protocol. That distinction matters when reading the failure domains: the backup service and its hosting system are not independent physical machines.
NFS keeps data available to workloads, ZFS replication creates another copy of selected datasets, and PBS stores VM backups. None of those arrows, on its own, proves that a restore has been tested successfully. The diagram describes the configured relationships, not a recovery certificate.
The storage story has a few previous chapters: the original DIY NAS build and the TrueNAS performance investigation. They explain earlier hardware decisions and troubleshooting, rather than serving as specifications for the current pools.
3. Follow a request from the Internet to a pod
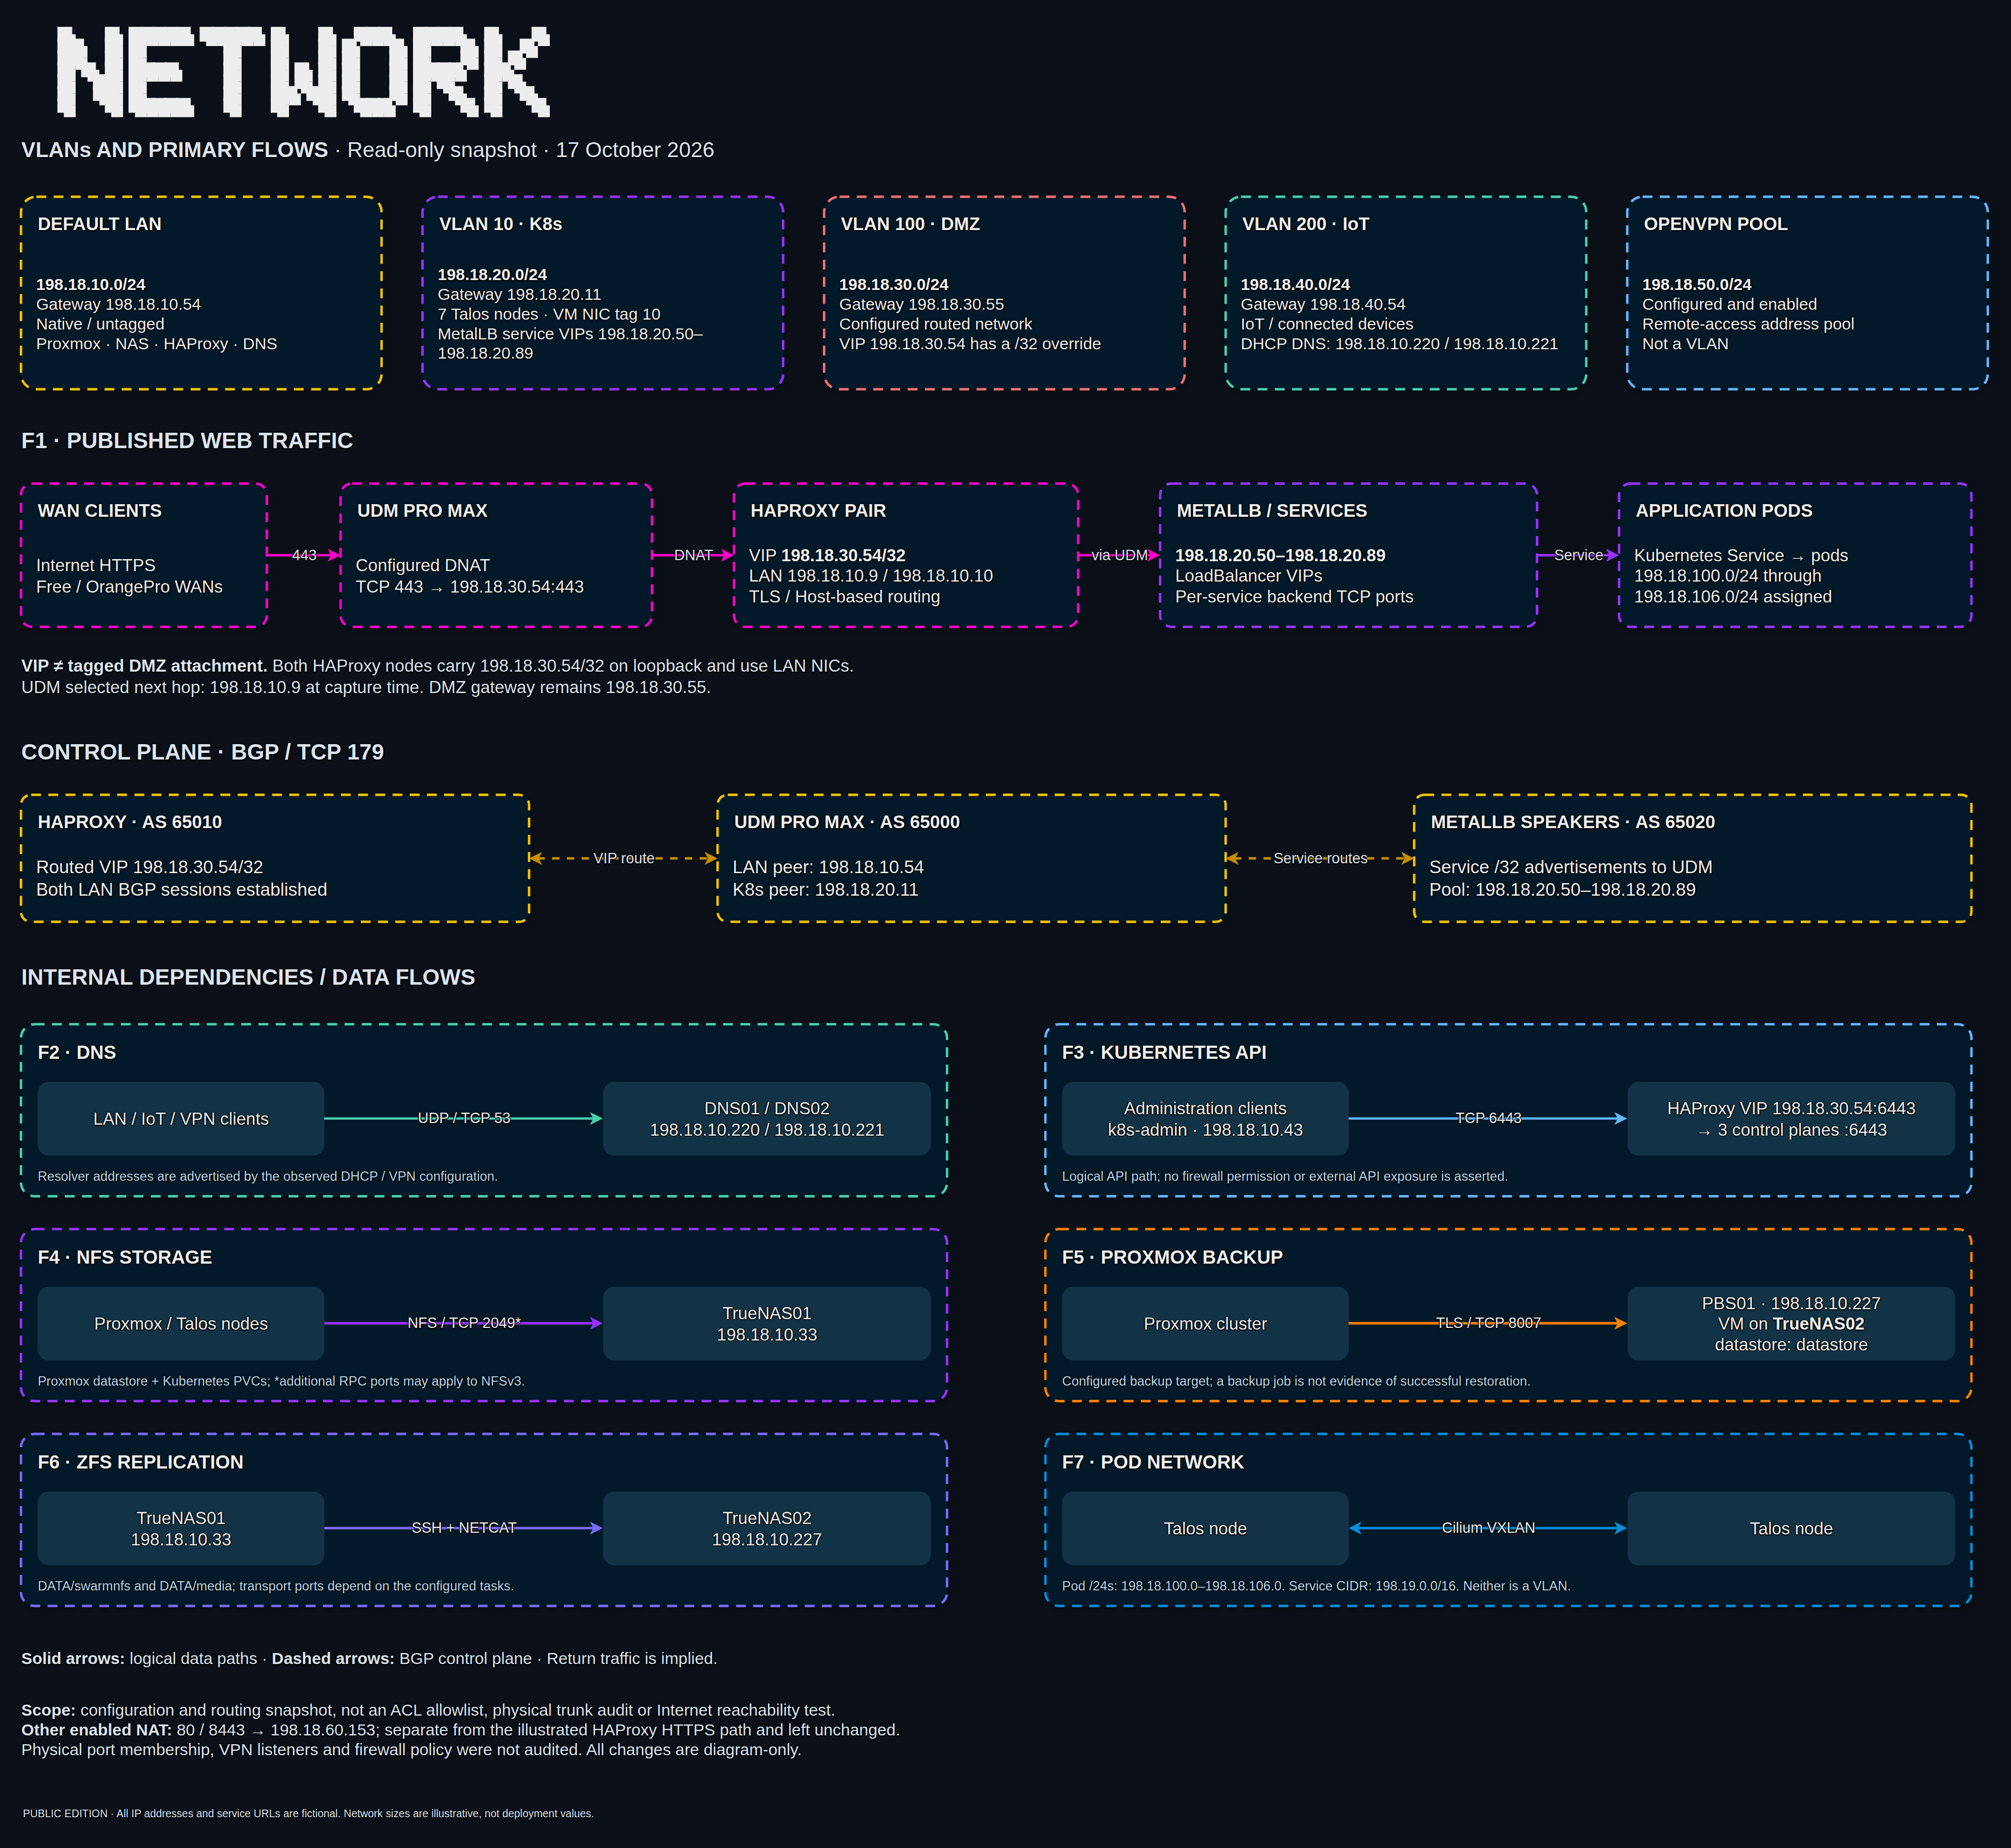
The network view separates the native LAN, the Kubernetes VLAN, the configured DMZ network, the IoT VLAN and the OpenVPN remote-access pool. The VPN pool is an address pool, not an extra VLAN. Likewise, Kubernetes pod and Service ranges are virtual cluster networks, not switch VLANs.
The UniFi Dream Machine Pro Max is the routing and WAN entry point in the illustrated web path. The UniFi aggregation and access switches provide the physical connectivity visible in the rack. Their presence does not, by itself, describe every firewall rule or physical trunk.
For the published HTTPS path, start with the WAN client and follow the solid arrows:
- The request arrives on TCP 443 at the UDM.
- The configured destination NAT sends it towards the HAProxy virtual address.
- The HAProxy pair handles TLS and hostname-based routing.
- The request is routed to the appropriate backend, including MetalLB-backed Kubernetes Services.
- The Kubernetes Service directs traffic towards the application pods.
People sometimes ask why both HAProxy and MetalLB are there. They are solving different problems. HAProxy looks at the web request and selects its backend. MetalLB gives Kubernetes LoadBalancer Services addresses that the network can route to. Removing one does not magically give its job to the other.
Now look at the dashed BGP arrows. Those belong to the routing control plane, using TCP 179. HAProxy advertises the routed VIP, and MetalLB speakers advertise Service routes towards the UDM. BGP tells the router where traffic can go; it does not carry the user's HTTP request as an application proxy would.
There is a subtle but important detail in the updated drawing: the HAProxy VIP is a /32 address carried on loopback and routed through the LAN. Its address falling inside the illustrated DMZ range does not mean the HAProxy machines have a tagged DMZ attachment. Address allocation, routing and physical VLAN membership are separate facts.
The lower half of the diagram breaks out dependencies that a web-only drawing would hide: DNS on UDP/TCP 53, Kubernetes API access on TCP 6443, NFS storage on TCP 2049, PBS transport on TCP 8007, ZFS replication, and the Cilium pod network. The NFS and replication notes matter: their complete transport requirements depend on the configured protocol and task, so this is not a ready-made firewall allowlist.
4. No public DNS does not mean private
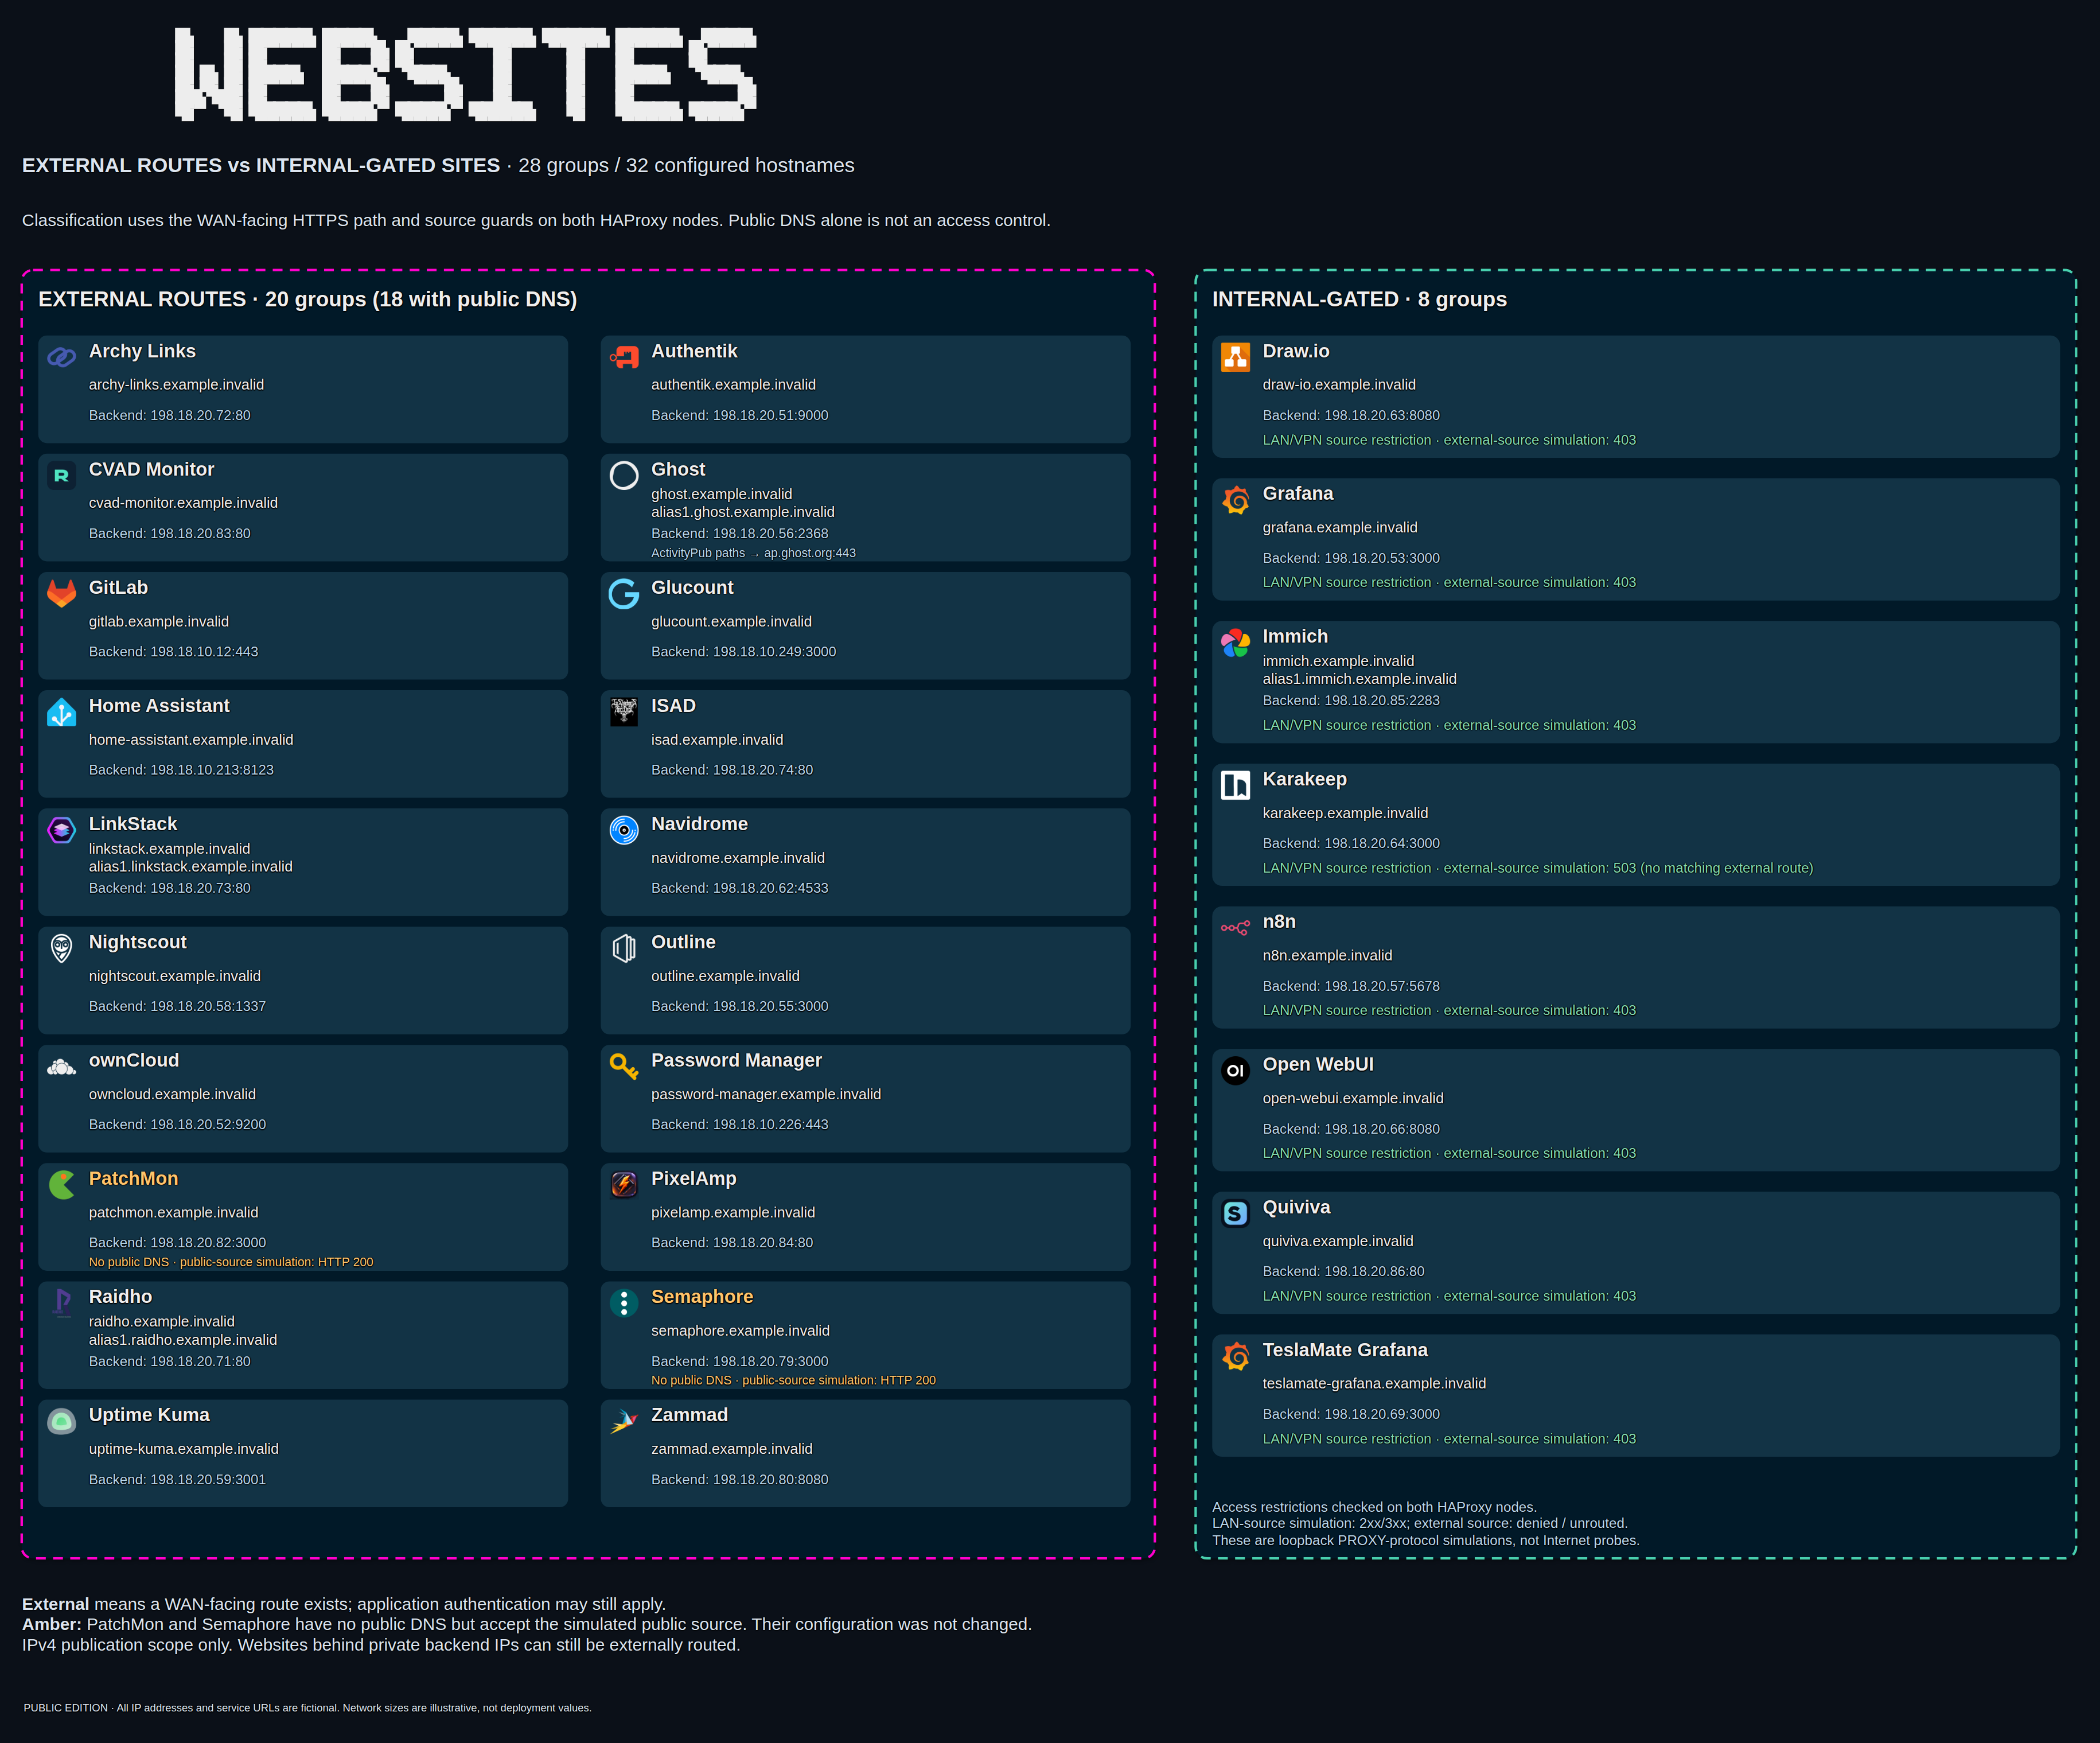
The websites view groups 32 configured hostnames into 28 website groups. Of those groups, 20 have an external route and eight are internally gated in the reviewed configuration. “External” means a WAN-facing route exists. It does not mean the application is anonymous, healthy, or independently tested from the Internet.
The external-route panel includes services such as Ghost for this blog, Authentik for identity, GitLab for code, Outline for documentation, ownCloud for files, Navidrome for music and Uptime Kuma for availability checks. Home Assistant, Nightscout, LinkStack, Zammad and the project websites also have their places in that access map.
The internally gated panel includes tools such as Grafana, Draw.io, Immich, Karakeep, n8n and Open WebUI. Their grouping describes the observed source restrictions, not a universal rule about where those products should be deployed.
Two amber entries are particularly useful: PatchMon and Semaphore. The diagram records external routes without public DNS for them. Their simulated public-source requests were accepted in the review. That is a practical reminder that hiding a DNS record is not an access control. A route can exist even if nobody has published a convenient name for it.
The source checks documented on this page were simulations against the HAProxy path, not independent Internet probes. That is enough to explain the classification, but not a reason to claim a broader security audit.
I covered the access-control approach in HAProxy ACLs and AdGuard Home DNS rewrites. That is useful background for this split: the proxy restriction does the access-control work; a friendly internal DNS name is only the convenient way to reach it.
5. Wait, 76 Services for 48 applications?
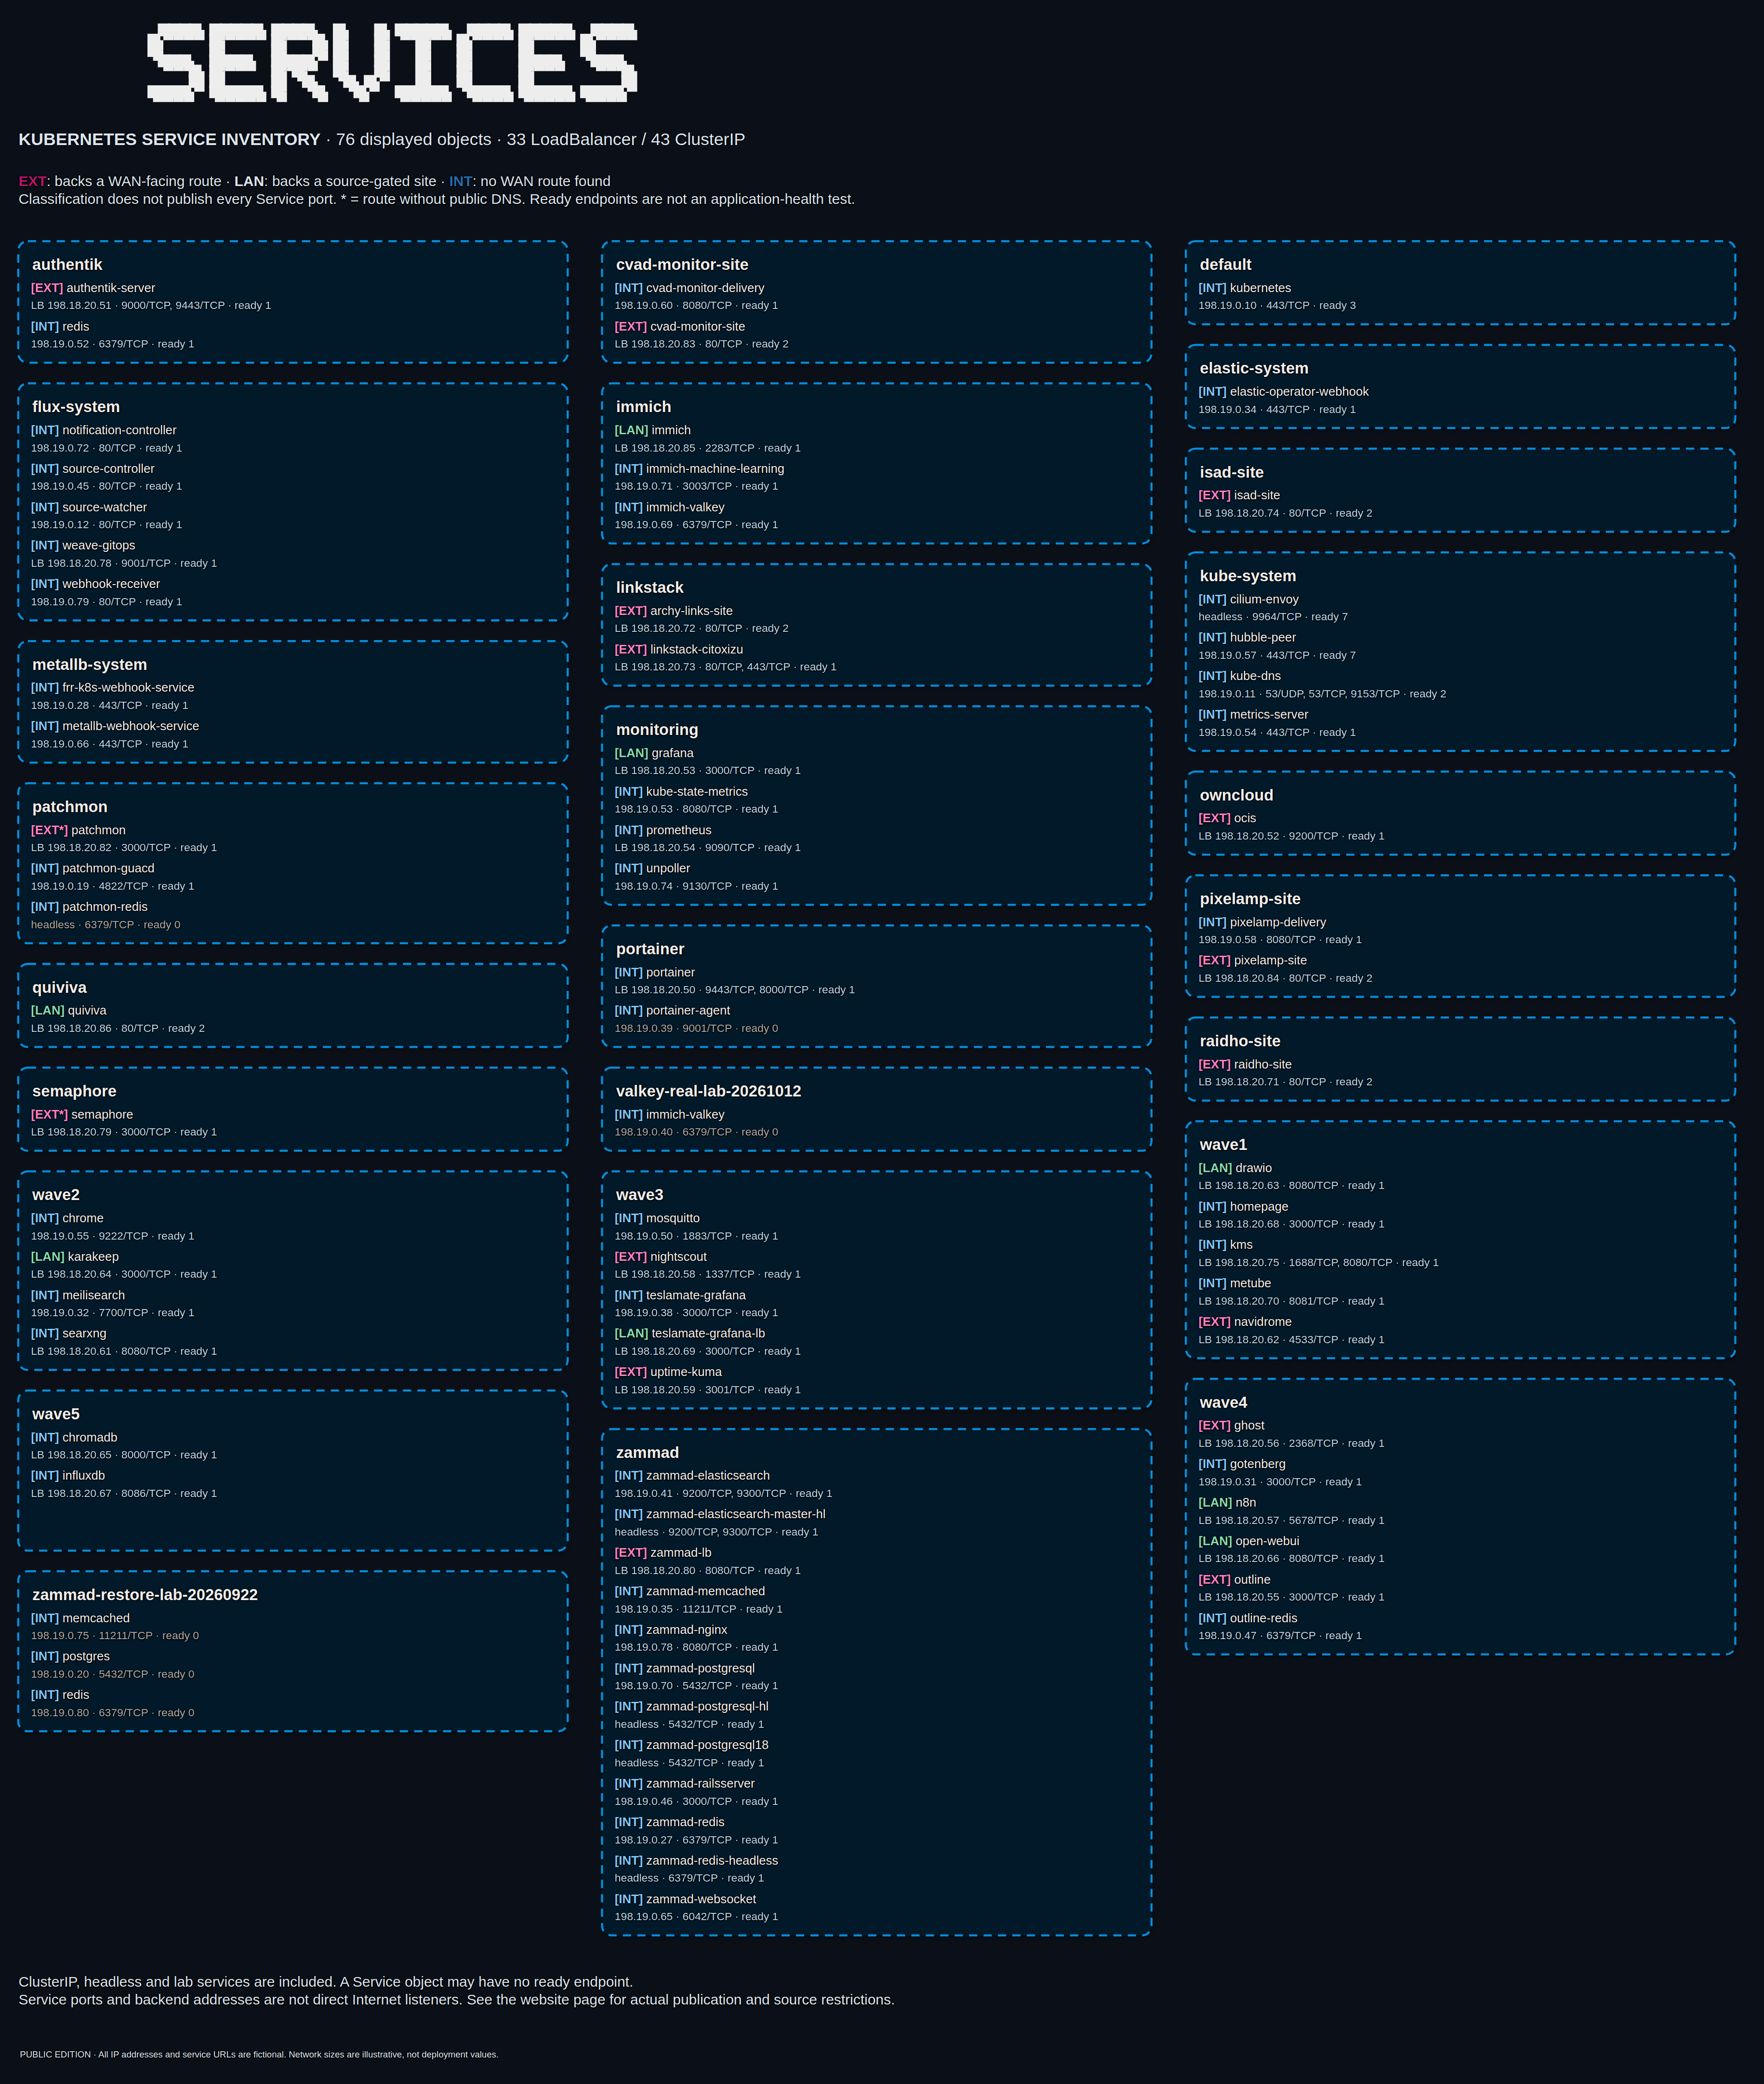
The Services sheet is the technical directory underneath the application overview. It lists 76 displayed Service objects: 33 LoadBalancer and 43 ClusterIP. That is not 76 applications, and certainly not 76 public websites.
A single application can need several internal endpoints: a web frontend, a database, a cache, background processing and a websocket service. Zammad is a clear example in this inventory, with multiple backend components under one application name. Immich similarly has more behind it than the photo-library page a user opens.
Think of an application as the whole working system, not just its front page. Its web pods may use separate database and cache endpoints, while workers handle background tasks. Several Services can therefore belong to one application, and several pods can sit behind one Service.
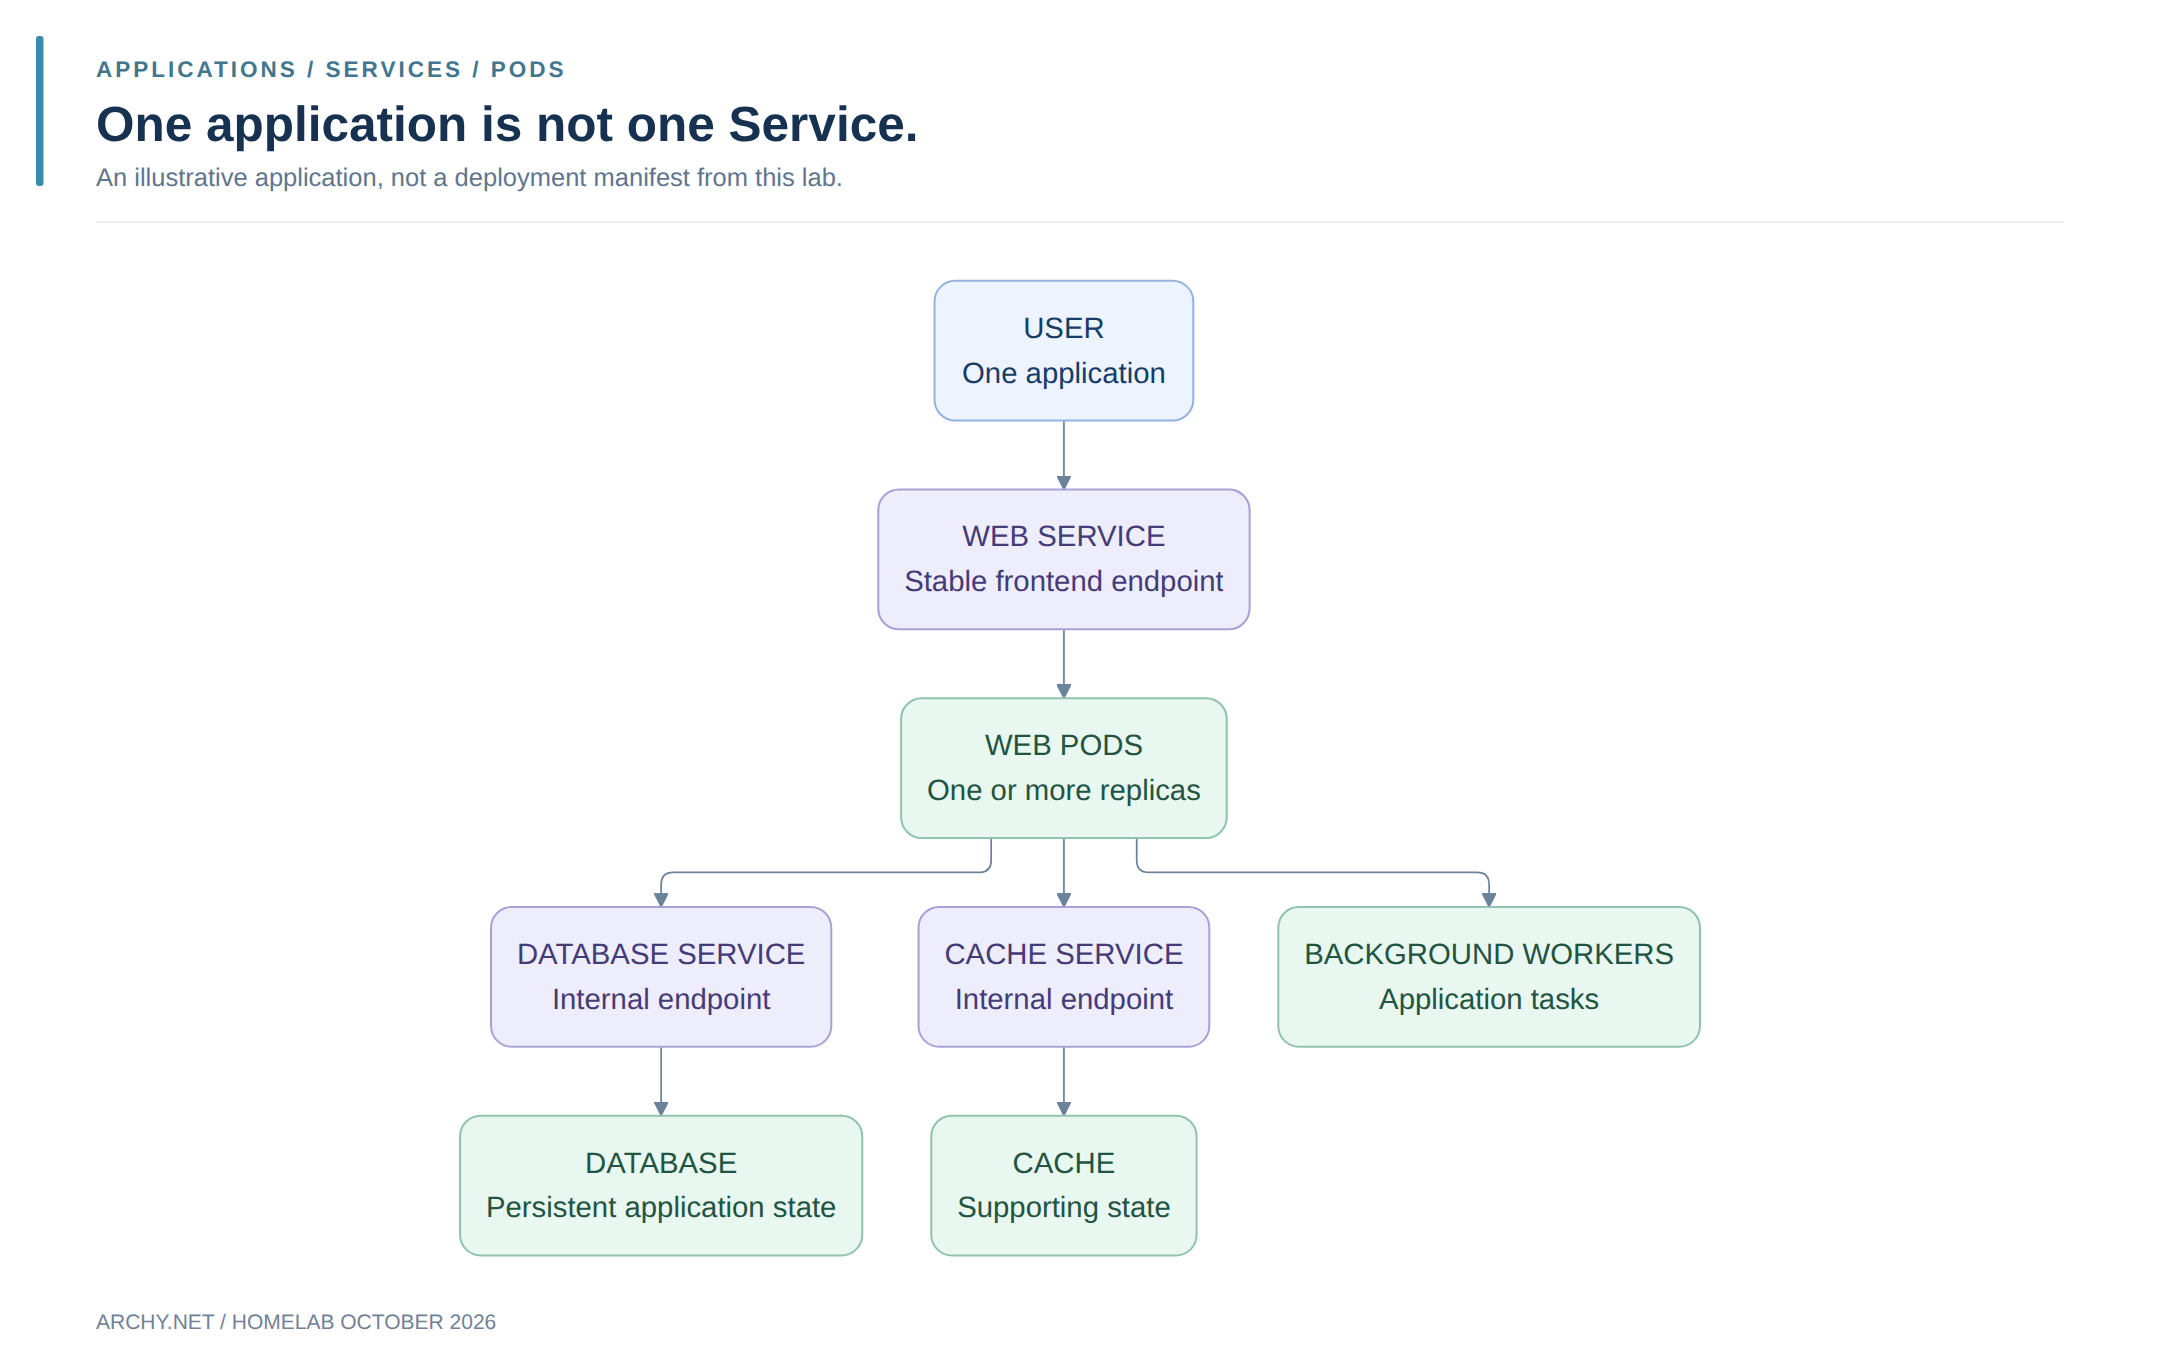
ClusterIP gives an internal Service address. LoadBalancer integrates a Service with an externally assigned address, here through MetalLB, but does not automatically publish it to the Internet. Headless Services support endpoint discovery without the usual virtual Service IP. The inventory also includes technical and lab objects, which is another reason not to equate the total with user-facing functionality.
The EXT, LAN and INT labels tie Services back to the observed web-routing classification. They do not mean every port on a classified Service is exposed in the same way. Likewise, a ready endpoint is a Kubernetes observation, not proof that an application workflow works end to end.
I would not start a tour of the lab with this sheet. But when a frontend works and a background component does not, this is the level of detail you need. The friendly application name stops being enough.
For a concrete application example, the PatchMon migration follows the move from a standalone Docker server into Kubernetes, including the data and agents that had to keep working.
6. Not everything needs to live in Kubernetes
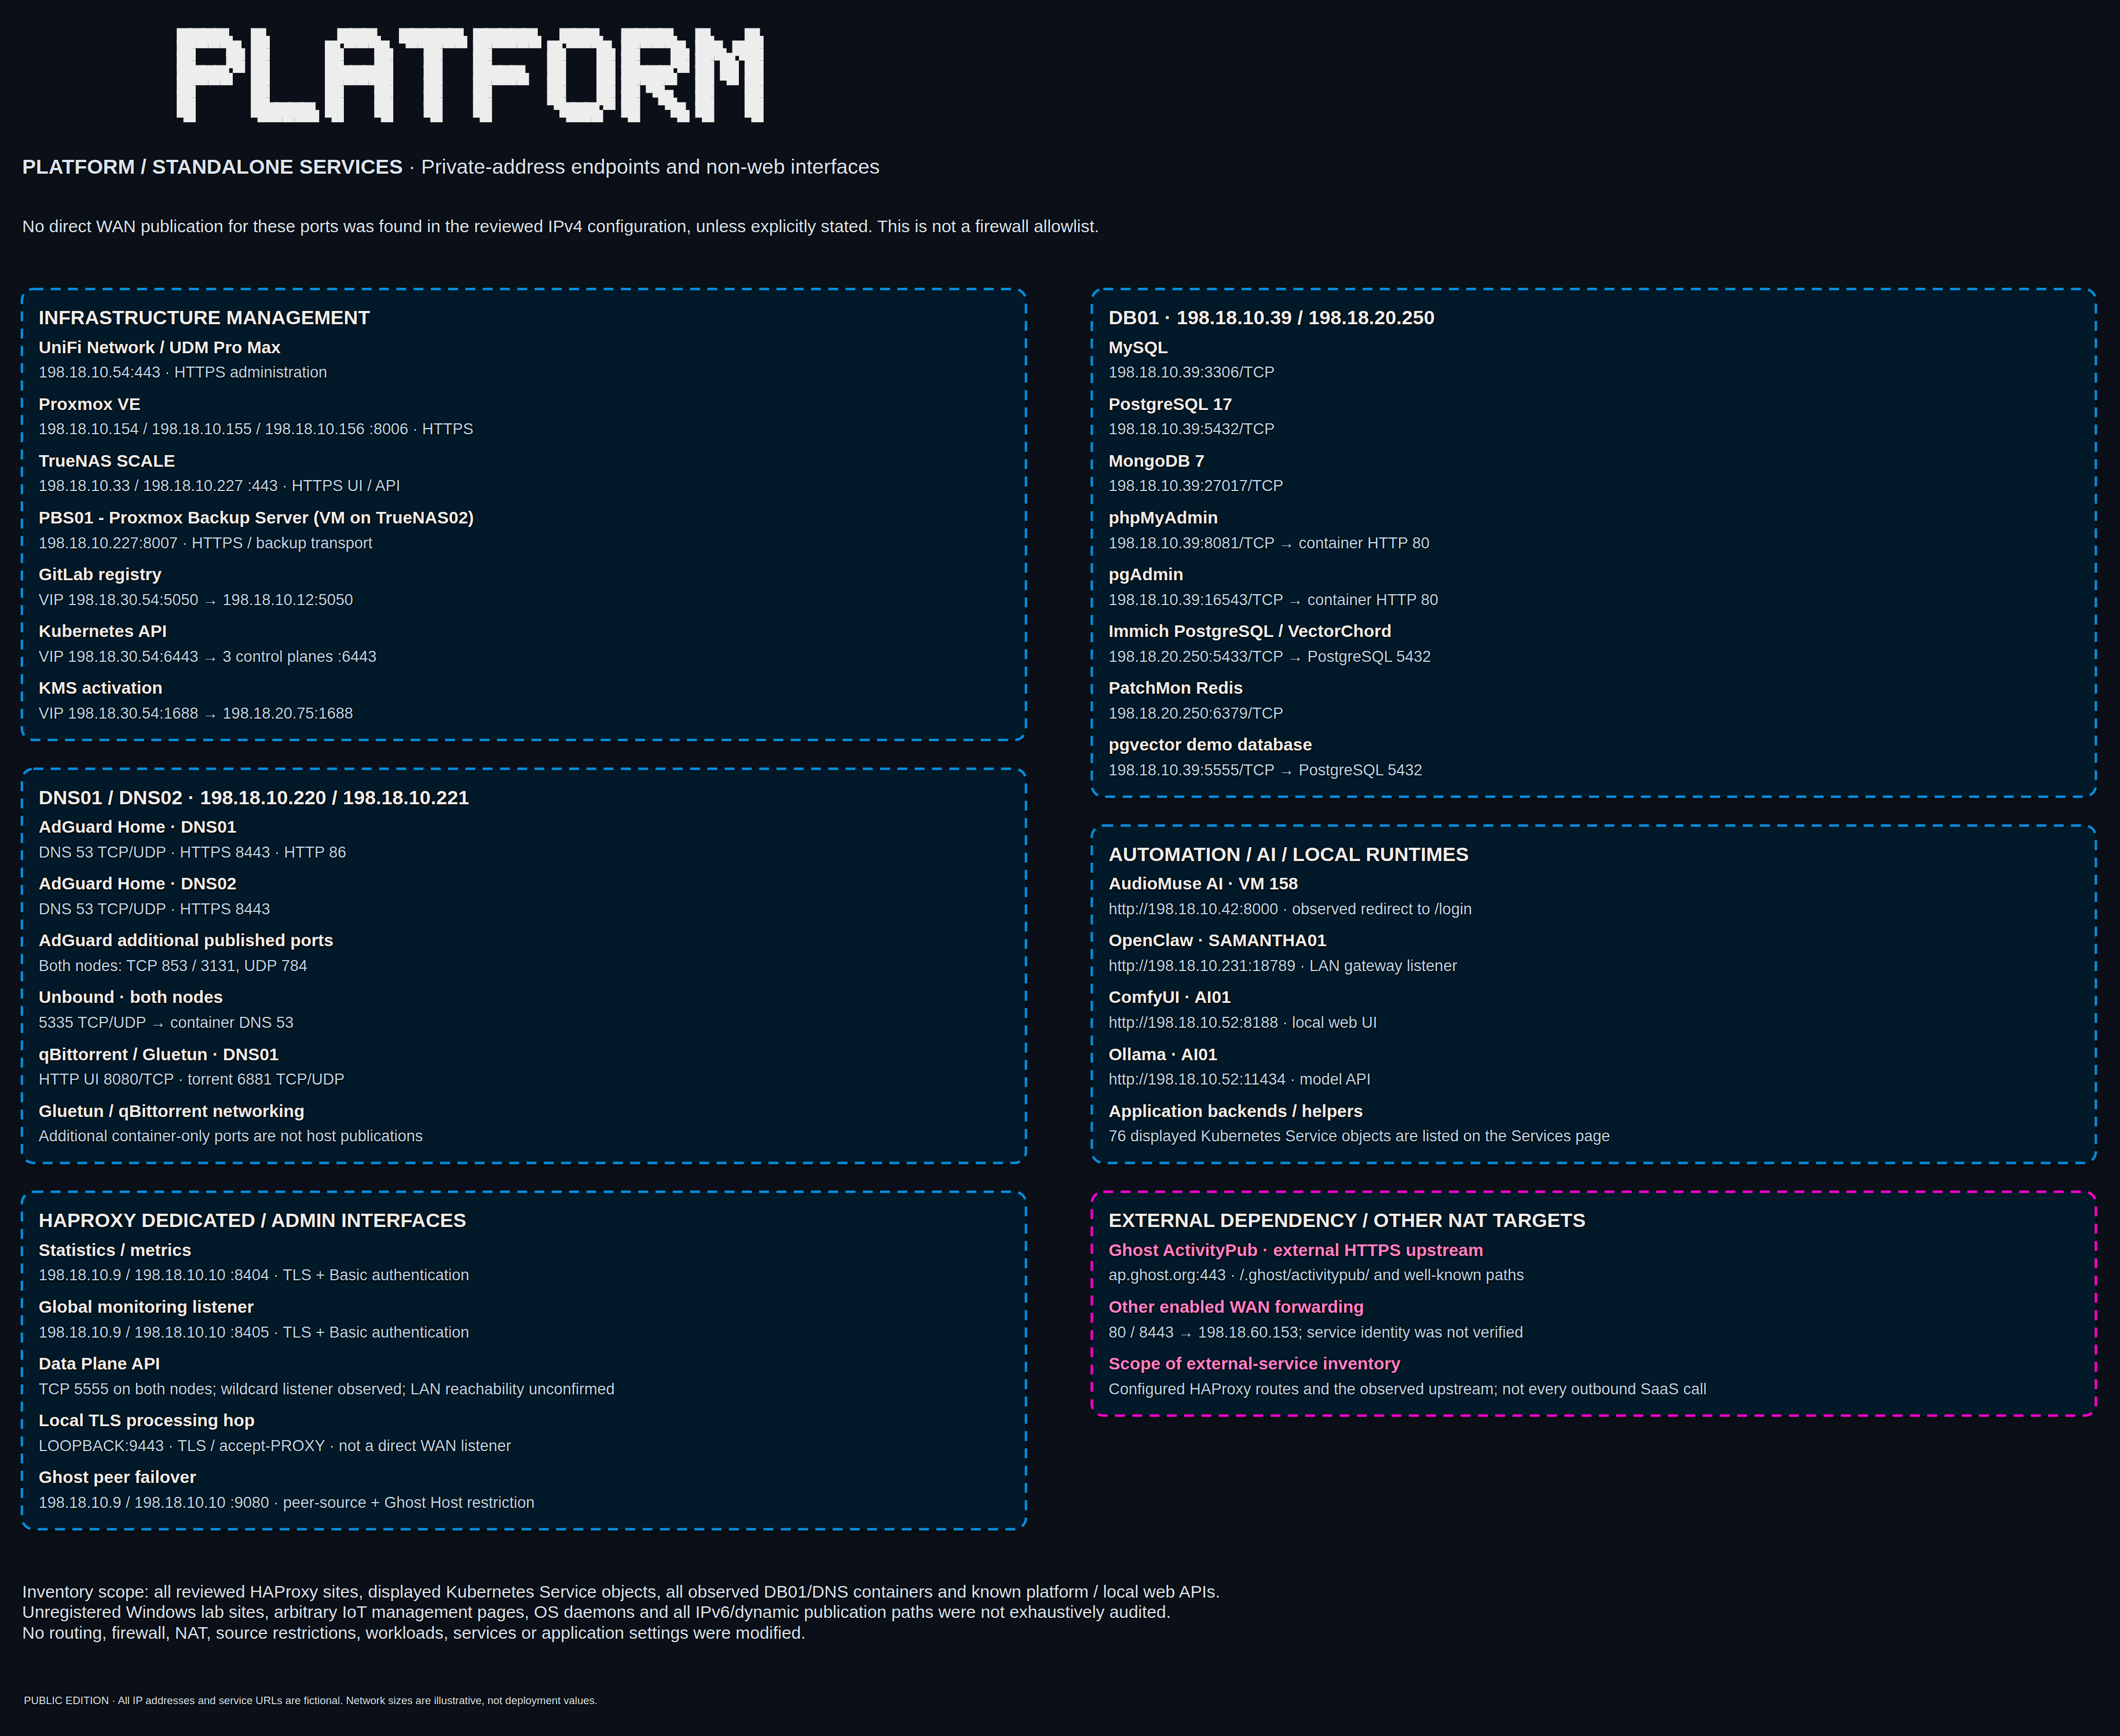
Kubernetes takes up plenty of space in this update, but it is not the whole lab. DNS, databases, management interfaces and local AI runtimes still need somewhere on the map. Calling everything a cluster would hide some fairly important dependencies.
DNS01 and DNS02 run AdGuard Home and Unbound outside Kubernetes. AdGuard provides filtering and the client-facing DNS layer; Unbound supplies recursive resolution in that stack. Their separate placement makes the dependency visible instead of burying basic name resolution inside an application list.
The earlier AdGuard Home and Unbound article explains the filtering and recursive-resolution design. It describes the Swarm-era deployment; the current standalone placement is the one shown here.
DB01 is a standalone database host with services including MySQL, PostgreSQL and MongoDB, together with database administration interfaces and application-specific data services. Keeping those visible matters: restarting an application pod does not relocate or restore its external database.
HAProxy's administration and monitoring interfaces are listed separately from published websites. Metrics, the Data Plane API and internal proxy-processing listeners are operational interfaces, not interchangeable web frontends. The diagram records where they were observed without claiming that all were reachable from every LAN segment.
The AI and automation section shows Ollama for model serving, ComfyUI for visual workflows, OpenClaw for the assistant gateway and automation, and AudioMuse AI for music analysis. These local runtimes sit alongside Kubernetes rather than becoming Kubernetes workloads merely because another application calls their API.
For the assistant side of that picture, the OpenClaw installation article introduces the local gateway and model choices. Treat its installation steps as the version documented at the time, not a replacement for current release instructions.
There is also an external dependency worth making explicit: some Ghost ActivityPub paths use an external HTTPS upstream. Self-hosting the blog does not mean every feature is contained within the rack.
Six views, one lab
Start with the rack view for orientation. Use the storage sheet to understand data dependencies, and the network sheet to follow a packet. Then use Websites to understand access categories, Services to find Kubernetes endpoints, and Platform for everything outside the cluster.
That is why I kept six separate views. A giant poster is fun to zoom into, but it is a poor answer to a specific question. If I want to know where a volume lives, I should not have to search past every application icon to find it.
The Homelab page remains the index for this snapshot and the earlier articles. Those older posts are still useful accounts of the work, but some describe components that have since moved or been replaced. Read their dates before treating them as the current architecture.
The drawings will age, of course. That is what homelab diagrams do. For now, they describe the October configuration, not live health, a complete firewall audit or a successful restore test. More importantly, I can finally send someone the link without adding a paragraph about everything that has changed since I drew it.