Setting up proper monitoring for HAProxy in a high availability configuration is crucial for maintaining service reliability and quickly identifying issues. This guide walks you through creating a complete monitoring solution using Prometheus and Grafana, with a custom dashboard that provides deep insights into your HAProxy HA setup.
Prerequisites
- Two HAProxy instances configured for high availability
- Prometheus server
- Grafana instance
- HAProxy 2.0+ with Prometheus metrics support
Step 1: Enable Prometheus Metrics in HAProxy
First, modify your HAProxy configuration to expose Prometheus metrics. Add this to your stats frontend:
# Enhanced Stats Frontend
frontend stats_frontend
    bind *:8404 ssl crt /etc/haproxy/certs/
    bind 127.0.0.1:8404

    # Add Prometheus metrics endpoint
    http-request use-service prometheus-exporter if { path /metrics }

    # Security: restrict access by IP if needed
    # acl allowed_ips src 10.0.0.0/8 172.16.0.0/12
    # http-request deny unless allowed_ips

    # Enhanced authentication and features
    stats enable
    stats uri /
    stats realm HAProxy\ High\ Availability\ Statistics
    stats auth admin:your_secure_password_here
    stats auth monitor:readonly_monitor_pass
    stats auth readonly:readonly_view_pass

    # Enhanced stats display options
    stats refresh 5s
    stats show-legends
    stats show-node
    stats admin if { src 10.0.0.0/8 }
    stats hide-version

    # Security headers
    http-response set-header X-Frame-Options SAMEORIGIN
    http-response set-header X-Content-Type-Options nosniff
    http-response set-header Strict-Transport-Security "max-age=15552000; includeSubDomains; preload"
Restart HAProxy and verify metrics are accessible:
curl -k https://haproxy-instance:8404/metrics
Step 2: Configure Prometheus
Add your HAProxy instances to Prometheus configuration (prometheus.yml):
global:
  scrape_interval: 15s

scrape_configs:
  - job_name: 'haproxy-primary'
    static_configs:
      - targets: ['lb-primary.example.com:8404']
    metrics_path: /metrics
    scrape_interval: 10s
    scheme: https
    tls_config:
      insecure_skip_verify: true
    basic_auth:
      username: 'monitor'
      password: 'readonly_monitor_pass'

  - job_name: 'haproxy-secondary'
    static_configs:
      - targets: ['lb-secondary.example.com:8404']
    metrics_path: /metrics
    scrape_interval: 10s
    scheme: https
    tls_config:
      insecure_skip_verify: true
    basic_auth:
      username: 'monitor'
      password: 'readonly_monitor_pass'
Restart Prometheus and verify targets are UP in the Prometheus web interface.
Step 3: Set Up Alerting Rules
Create comprehensive alerting rules (haproxy-alerts.yml):
groups:
  - name: haproxy-ha-alerts
    rules:
      # Critical: HAProxy instance down
      - alert: HAProxyInstanceDown
        expr: up{job=~"haproxy.*"} == 0
        for: 1m
        labels:
          severity: critical
          service: haproxy
        annotations:
          summary: "HAProxy instance {{ $labels.instance }} is down"
          description: "HAProxy instance {{ $labels.instance }} has been down for more than 1 minute"

      # Critical: Both HAProxy instances down
      - alert: HAProxyBothInstancesDown
        expr: count(up{job=~"haproxy.*"} == 0) >= 2
        for: 30s
        labels:
          severity: critical
          service: haproxy
        annotations:
          summary: "CRITICAL: Both HAProxy instances are down"
          description: "Complete HAProxy failure - all instances are down"

                # Critical: Single-point services down
      - alert: CriticalServiceDown
        expr: haproxy_server_status{proxy=~"auth_backend|database_backend|api_backend"} == 0
        for: 2m
        labels:
          severity: critical
          service: "{{ $labels.proxy }}"
        annotations:
          summary: "Critical service {{ $labels.proxy }} is down"
          description: "Service {{ $labels.proxy }}/{{ $labels.server }} has been down for more than 2 minutes"

      # Warning: Docker cluster degraded
      - alert: DockerClusterDegraded
        expr: count by (proxy) (haproxy_server_status{server=~"app.*"} == 1) < 2
        for: 5m
        labels:
          severity: warning
          service: "{{ $labels.proxy }}"
        annotations:
          summary: "Application cluster degraded for {{ $labels.proxy }}"
          description: "Service {{ $labels.proxy }} has less than 2 healthy application nodes available"

      # Warning: High error rate
      - alert: HAProxyHighErrorRate
        expr: rate(haproxy_backend_response_errors_total[5m]) > 0.1
        for: 3m
        labels:
          severity: warning
          service: "{{ $labels.proxy }}"
        annotations:
          summary: "High error rate on {{ $labels.proxy }}"
          description: "Backend {{ $labels.proxy }} has error rate of {{ $value }} errors/sec"

      # Warning: High response time
      - alert: HAProxyHighResponseTime
        expr: haproxy_backend_response_time_average_seconds > 2
        for: 5m
        labels:
          severity: warning
          service: "{{ $labels.proxy }}"
        annotations:
          summary: "High response time on {{ $labels.proxy }}"
          description: "Backend {{ $labels.proxy }} has average response time of {{ $value }}s"
Add to your prometheus.yml:
rule_files:
  - "haproxy-alerts.yml"

Step 4: Import the Custom Grafana Dashboard
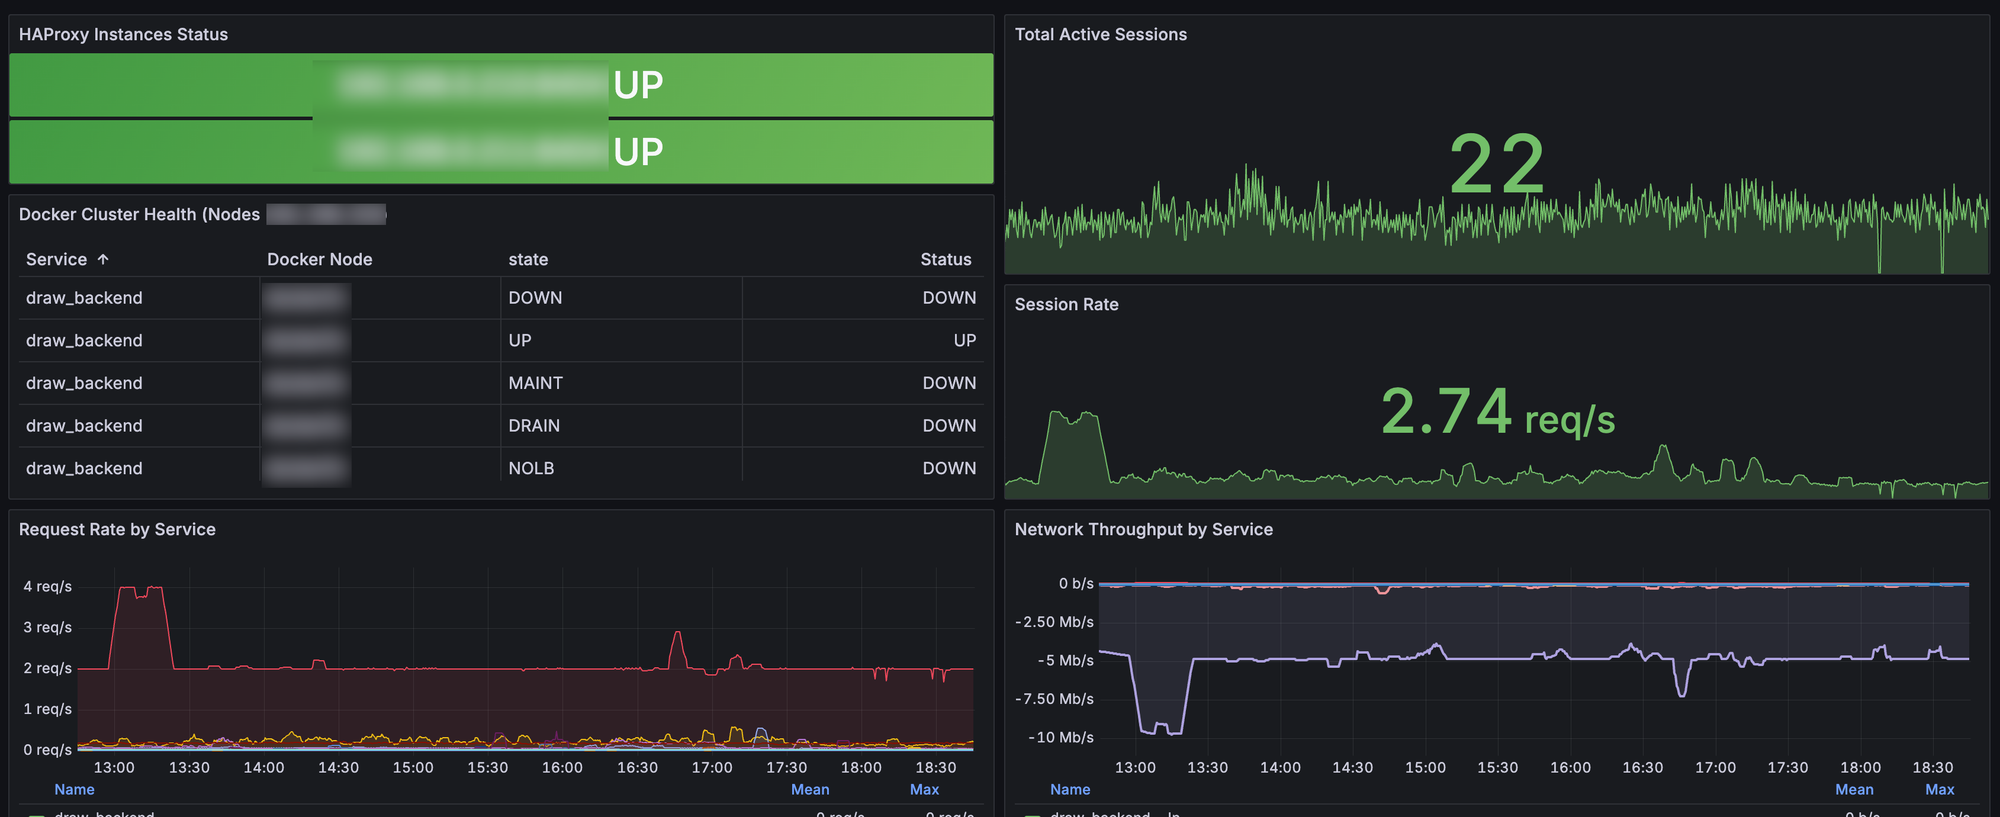
The dashboard provides comprehensive monitoring across eight key areas:
Dashboard Features
- Instance Health Monitoring - Real-time status of both HAProxy instances
- Session Tracking - Current active sessions and session rates
- Application Cluster Health - Status matrix for your container infrastructure
- Network Throughput - Bidirectional traffic analysis with in/out visualization
- Request Rate Analysis - HTTP request patterns by service
- Response Time Monitoring - Performance metrics across all backends
- Error Rate Tracking - Error detection and trending
- Service-Level Insights - Individual backend performance
Import Steps
- Copy the Dashboard JSON: Use the complete JSON configuration from your exported dashboard
- Import in Grafana:
- Navigate to Dashboards → New → Import
- Paste the JSON content
- Select your Prometheus data source
- Click Import
Key Metrics Monitored
The dashboard tracks these critical metrics:
High Availability Metrics:
up{job=~"haproxy.*"}- Instance availabilityhaproxy_server_status- Backend server healthhaproxy_backend_status- Backend pool status
Performance Metrics:
haproxy_frontend_current_sessions- Active sessionsrate(haproxy_backend_http_responses_total[5m])- Request ratehaproxy_backend_response_time_average_seconds- Response times
Throughput Metrics:
rate(haproxy_backend_bytes_in_total[5m]) * 8- Inbound bandwidthrate(haproxy_backend_bytes_out_total[5m]) * 8- Outbound bandwidth
Error Tracking:
rate(haproxy_backend_response_errors_total[5m])- Error ratesincrease(haproxy_server_check_failures_total[5m])- Health check failures
Download the json here :

Step 5: Configure Grafana Alerting
Set up Grafana alerts for immediate notifications:
- HAProxy Instance Down Alert:
- Query:
up{job=~"haproxy.*"} - Condition: IS BELOW 1
- Evaluation: Every 10s for 1m
- Query:
- Critical Service Down Alert:
- Query:
haproxy_server_status{proxy=~"auth_backend|database_backend|api_backend"} - Condition: IS BELOW 1
- Evaluation: Every 30s for 2m
- Query:
- High Error Rate Alert:
- Query:
rate(haproxy_backend_response_errors_total[5m]) - Condition: IS ABOVE 0.1
- Evaluation: Every 1m for 3m
- Query:
Step 6: Testing Your Setup
Validate your monitoring setup:
Functional Tests
- Test Dashboard Panels:
- Confirm both HAProxy instances show as "UP"
- Verify application cluster health table populates
- Check throughput graphs display data
Alert Testing:
# Simulate instance failure
sudo systemctl stop haproxy

# Wait for alert to trigger (should be within 1-2 minutes)
# Check Grafana Alerting → Alert Rules
Verify Metrics Collection:
# Check HAProxy metrics endpoint
curl -k https://lb-instance.example.com:8404/metrics

# Verify in Prometheus
# Navigate to Prometheus UI → Status → Targets
Performance Validation
Monitor these key indicators during testing:
- Response Times: Should remain under 500ms for most services
- Error Rates: Should stay below 0.01% under normal conditions
- Throughput: Verify bidirectional traffic visualization
- Session Distribution: Ensure load balancing across instances

This comprehensive monitoring setup provides visibility into every aspect of your HAProxy HA configuration. The dashboard offers real-time insights into instance health, service performance, network throughput and error conditions.
Regular monitoring of these metrics enables proactive identification of issues before they impact users. The alerting rules ensure immediate notification of critical conditions, while the detailed dashboard provides the context needed for rapid troubleshooting.
Remember to regularly review and tune your alert thresholds based on your specific traffic patterns and performance requirements. Consider implementing automated runbooks for common failure scenarios to reduce mean time to resolution.