
Important Medical Disclaimer: This article describes a technical monitoring tool and is not medical advice. All diabetes management decisions should be made in consultation with your healthcare team. This system is designed to supplement, not replace, professional medical care and regular monitoring practices.
Introduction: Why Weekly Monitoring Matters for Families
Managing Type 1 diabetes in children requires constant vigilance, pattern recognition and data analysis. As parents and caregivers, we're often overwhelmed by the sheer volume of glucose data from Continuous Glucose Monitors (CGMs), trying to spot trends, correlations and optimization opportunities while juggling daily life.
After months of daily diabetes reports, I realized that while daily analysis provides immediate feedback, weekly summaries offer something equally valuable: the bigger picture. Weekly reports help identify patterns that daily fluctuations might obscure, reduce email fatigue and provide comprehensive trend analysis that's perfect for sharing with endocrinologists during appointments.
This technical deep dive explores how I built an automated weekly diabetes monitoring system that analyzes 7 days of glucose data, correlates it with weather patterns and generates AI-powered medical insights using the specialized alibayram/medgemma:27b medical language model.
The Technical Challenge: From Daily to Weekly Analysis
The Problem with Daily Reports
Daily diabetes reports, while valuable, have significant limitations that became apparent after months of use. The sheer volume of information creates an overwhelming experience, with 365 emails per year flooding inboxes and making it difficult to focus on truly important trends. Day-to-day variations often mask meaningful weekly patterns that could provide valuable insights into glucose management. Single-day analysis lacks the broader perspective needed to understand longer-term trends and cycles. Additionally, healthcare providers typically prefer weekly summaries during appointments rather than reviewing daily details, making daily reports less useful for medical consultations.
The Weekly Solution Architecture
The weekly monitoring system addresses these challenges through a comprehensive technical approach:
┌─────────────────┐    ┌──────────────────┐    ┌─────────────────┐
│   Nightscout    │───▶│  Weekly Analysis │───▶│  AI Insights    │
│   CGM Data      │    │     Engine       │    │  (MedGemma)     │
└─────────────────┘    └──────────────────┘    └─────────────────┘
                                │
                                ▼
┌─────────────────┐    ┌──────────────────┐    ┌─────────────────┐
│  Weather API    │───▶│  Correlation     │───▶│  Email Report   │
│   OpenWeather   │    │    Analysis      │    │   (HTML/PDF)    │
└─────────────────┘    └──────────────────┘    └─────────────────┘
Technical Implementation: Building the Weekly Analyzer
Core Architecture Components
Data Collection Engine
The weekly analysis system operates on a sophisticated data collection framework that handles the complexities of continuous glucose monitoring data across extended periods.
def run_weekly_analysis(self, start_time: datetime, end_time: datetime) -> Dict:
    """
    Analyzes 7-day glucose patterns with enhanced statistical analysis
    Period: Sunday 20:00 → Sunday 20:00 (168 hours)
    """
    # Fetch 7 days of CGM data from Nightscout
    raw_data = self.fetch_nightscout_data(start_time, end_time)
    times, values = self.process_glucose_data(raw_data)

    # Enhanced statistics for weekly analysis
    stats = self.calculate_weekly_statistics(values)

    # Weather correlation over 7-day period
    weather_analysis = self.analyze_weather_correlation()

    return self.generate_comprehensive_report(times, values, stats, weather_analysis)
Enhanced Statistical Analysis
The weekly system calculates more comprehensive metrics than daily reports, providing deeper insights into glucose management patterns over extended periods.
def calculate_weekly_statistics(self, values: List[float]) -> Dict:
    """
    Calculate comprehensive weekly glucose statistics
    """
    return {
        'total_readings': len(values),
        'mean_glucose': np.mean(values),
        'median_glucose': np.median(values),
        'std_glucose': np.std(values),
        'coefficient_variation': (np.std(values) / np.mean(values)) * 100,
        'time_in_range_pct': self.calculate_tir(values),
        'gmi': 3.31 + (0.02392 * np.mean(values)),  # Glucose Management Indicator
        'weekly_trend': self.calculate_weekly_trend(values),
        'daily_averages': self.calculate_daily_breakdown(values)
    }
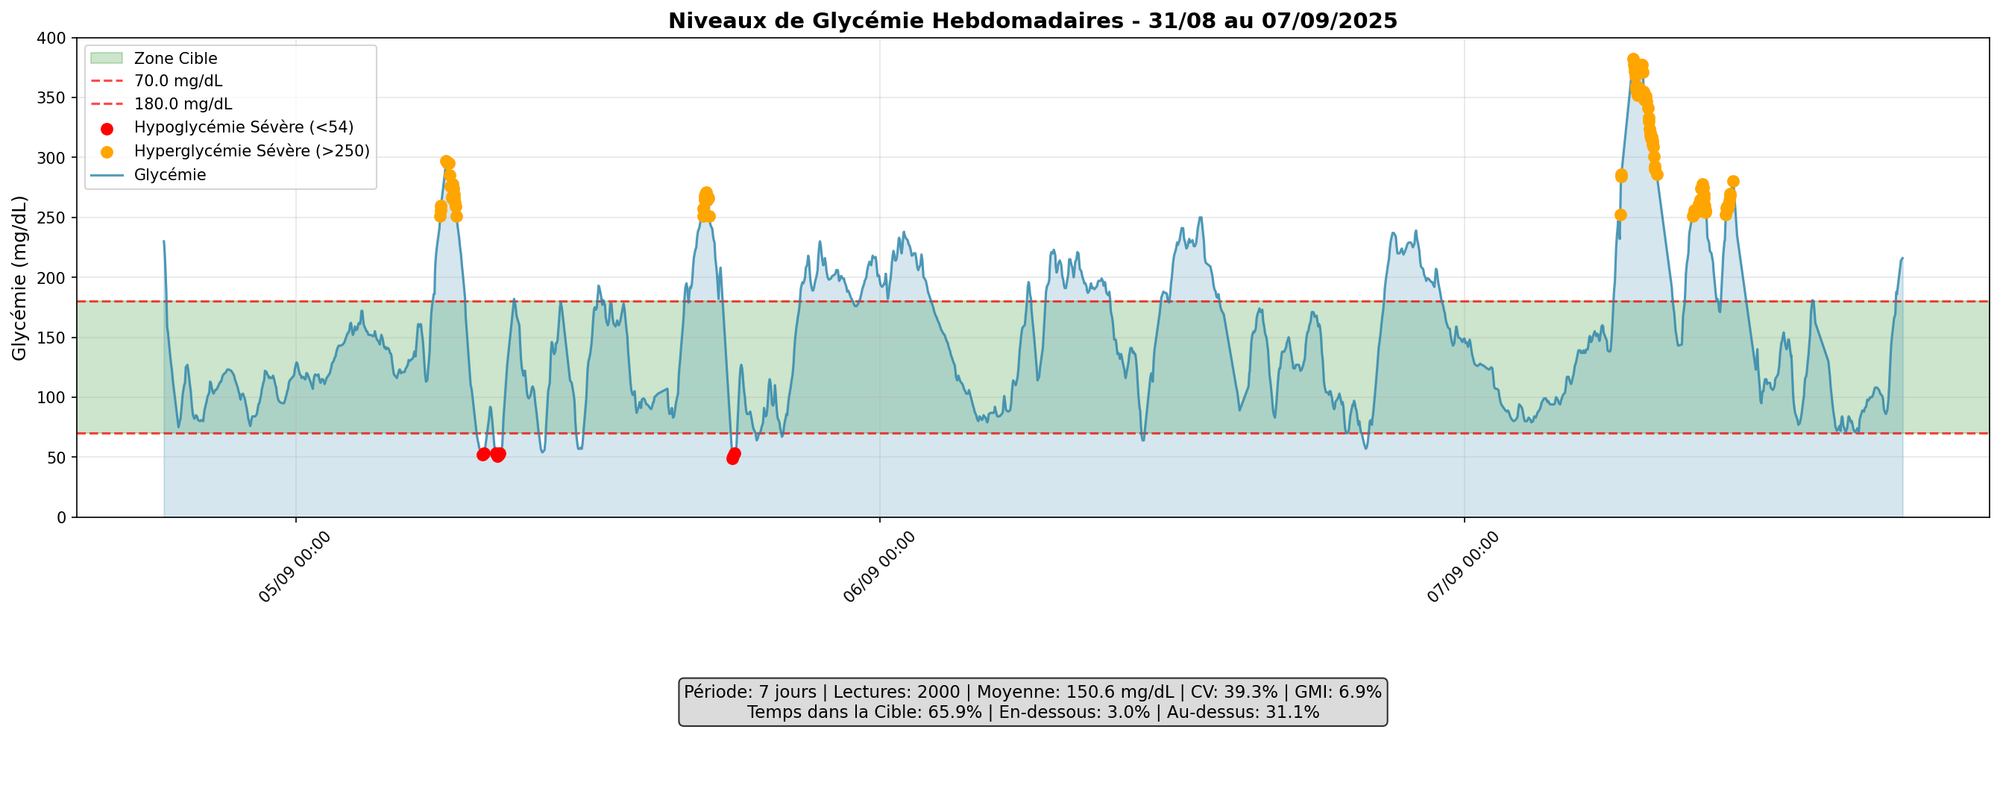
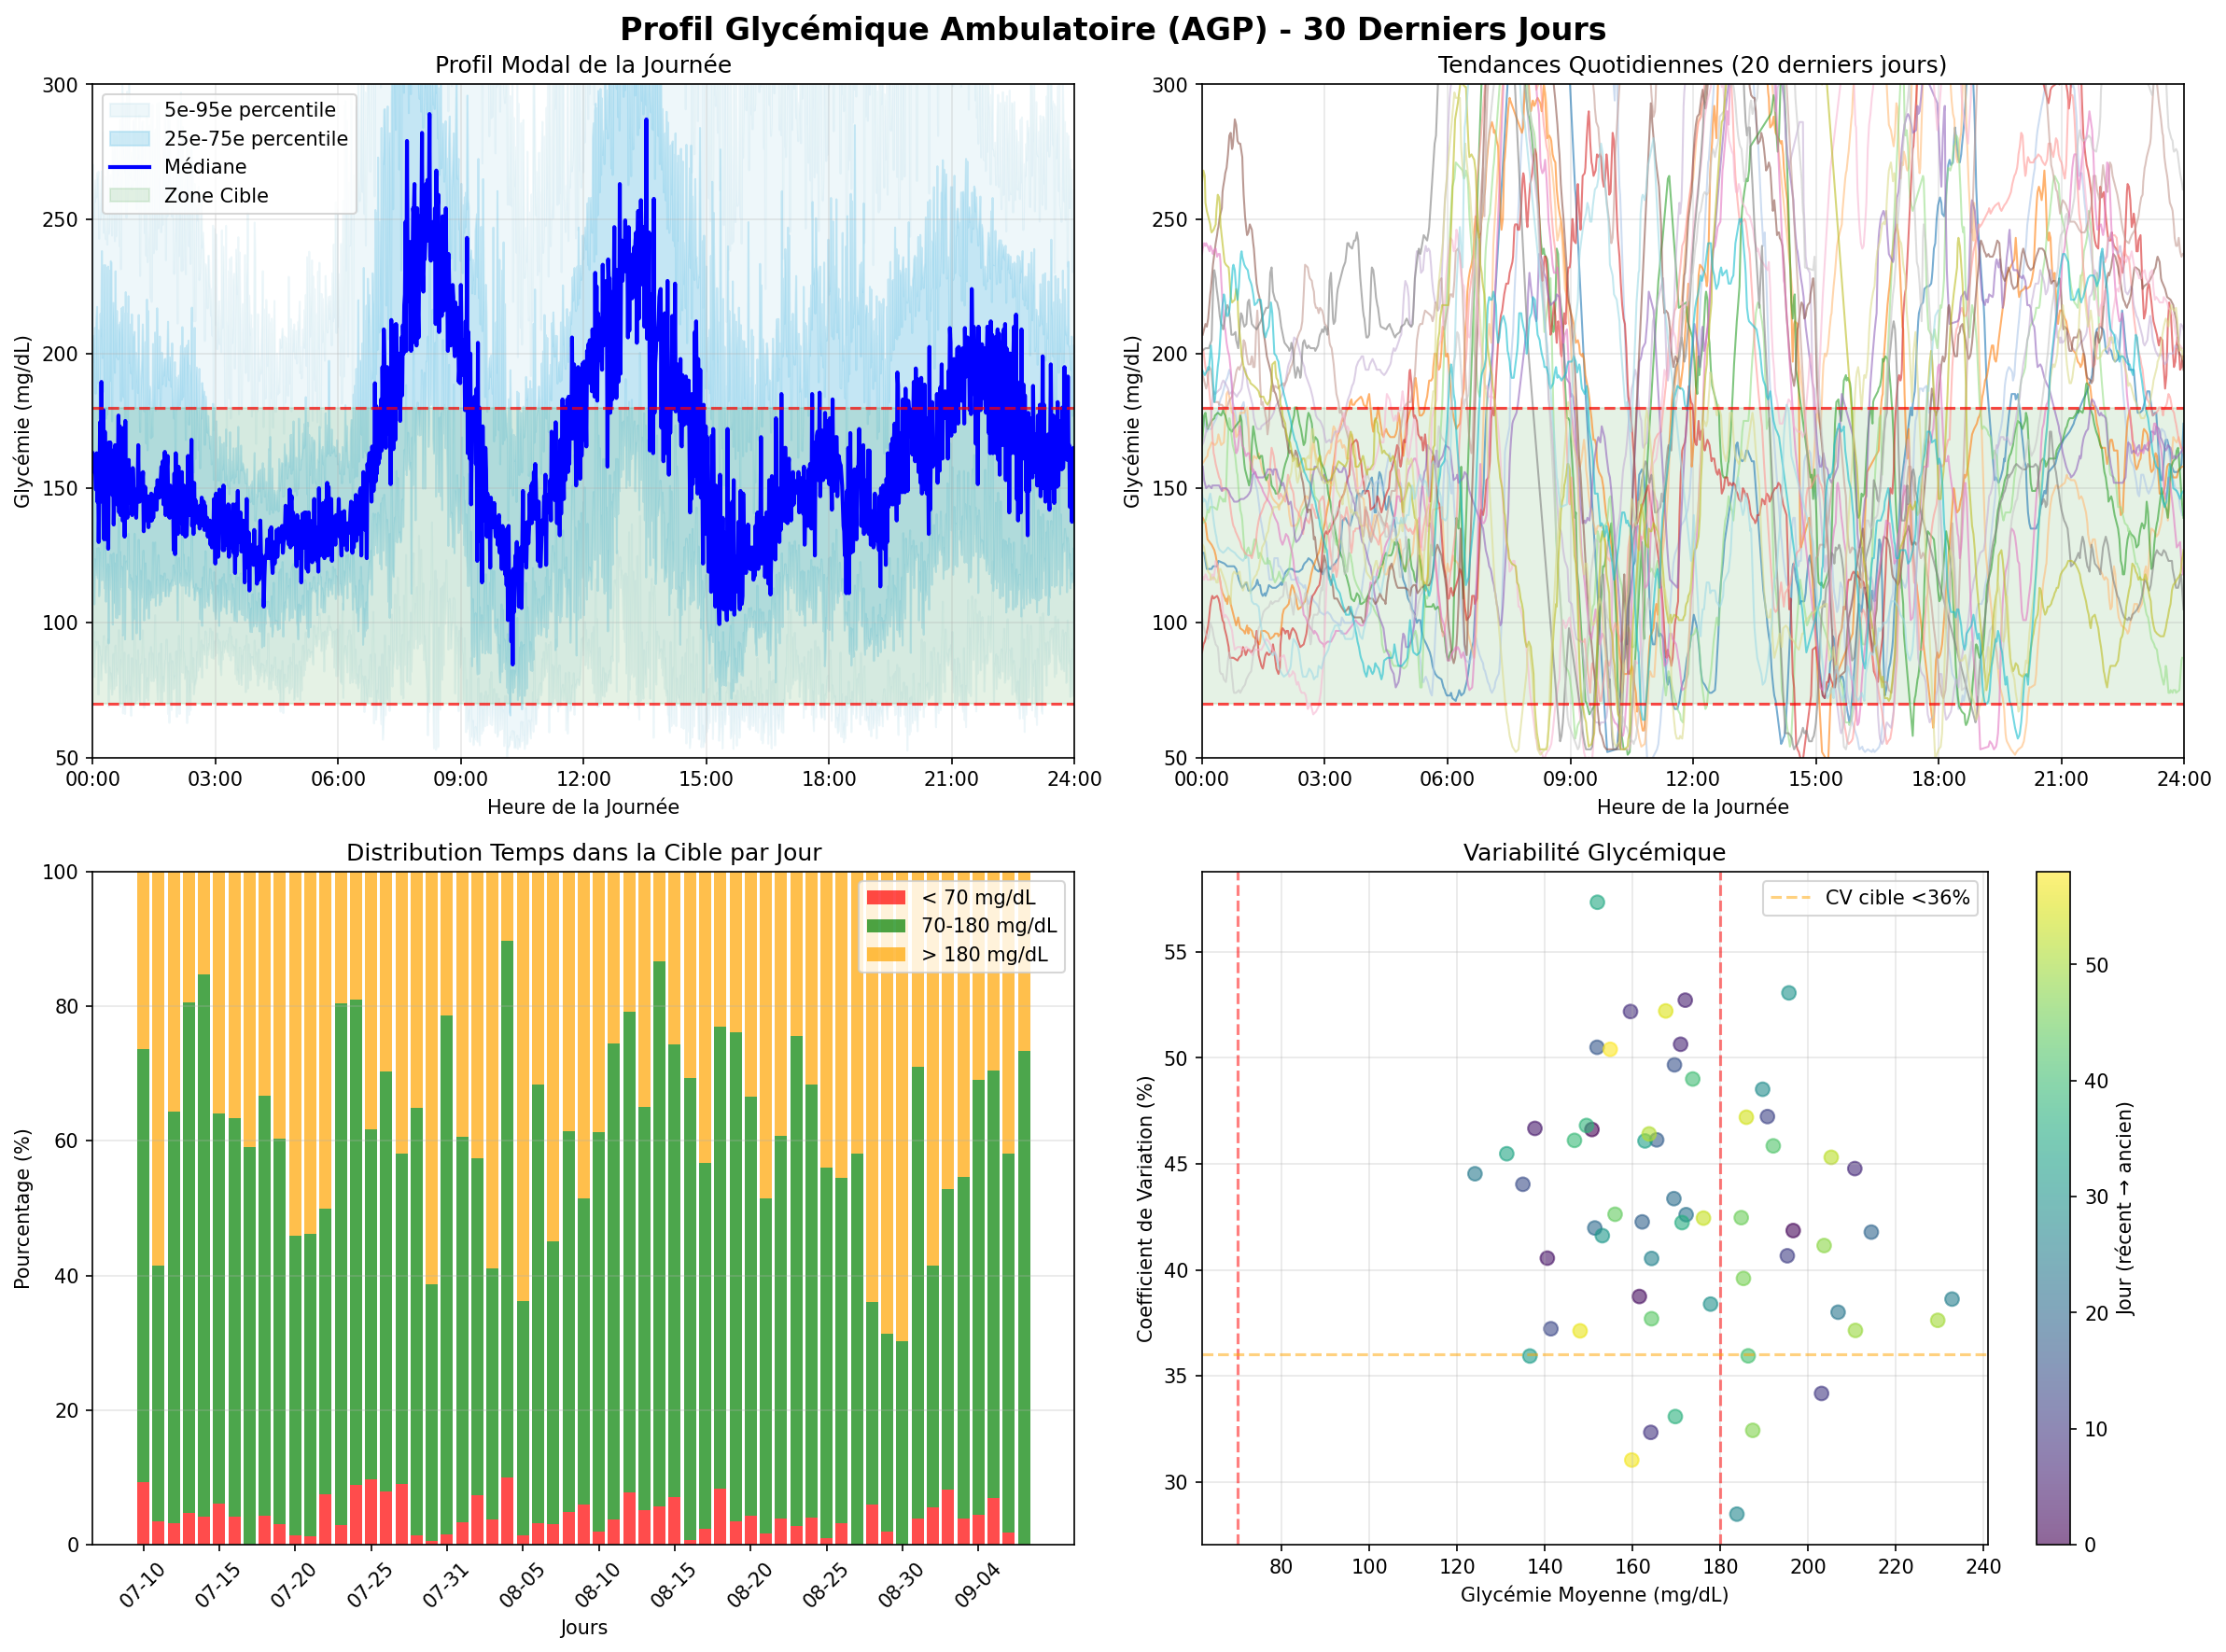
Advanced Chart Generation
Weekly reports include enhanced visualizations that provide comprehensive insights into glucose management patterns. The system generates weekly glucose trends showing a 7-day overview with daily markers for easy pattern recognition. Enhanced AGP charts incorporate 60-day historical data to provide better context for current trends. Weather correlation analysis extends across the full week to identify environmental impacts on glucose levels. Daily breakdown statistics present individual day metrics within the weekly period for detailed analysis.
The AI Component: Medical Analysis with MedGemma
AI Processing Options: Local vs Cloud
The system supports two distinct AI processing approaches, each with specific advantages and privacy implications that families should carefully consider.
Local Processing with alibayram/medgemma:27b (Recommended)

4b parameters model is available as well
For medical analysis, the alibayram/medgemma:27b model offers several compelling advantages for healthcare applications. Unlike general-purpose language models, MedGemma is specifically trained on medical literature and clinical data, making it uniquely qualified for diabetes analysis. The model demonstrates deep understanding of diabetes-specific terminology, patterns and clinical guidelines that are essential for meaningful medical insights.
Running locally via Ollama ensures complete data privacy since no glucose data ever leaves your system, addressing critical healthcare privacy concerns. The local deployment provides significant cost efficiency compared to cloud-based services that charge per token and offers full control over analysis parameters through customizable prompts.
Cloud Processing with OpenAI (Alternative Option)
Alternatively, the system can utilize OpenAI's models such as GPT-4 for medical analysis when local processing isn't feasible due to hardware limitations or setup complexity.
def generate_openai_analysis(self, data_summary: str) -> str:
    """
    Generate medical analysis using OpenAI API (reduced privacy)
    """
    try:
        response = openai.ChatCompletion.create(
            model="gpt-4",
            messages=[
                {
                    "role": "system",
                    "content": "You are a medical specialist analyzing diabetes data. Provide clinical insights and recommendations."
                },
                {
                    "role": "user",
                    "content": f"Analyze this weekly glucose data: {data_summary}"
                }
            ],
            temperature=0.7
        )
        return response.choices[0].message.content
    except Exception as e:
        logger.error(f"OpenAI analysis failed: {str(e)}")
        return "Cloud analysis unavailable"
Critical Privacy Considerations:
When using OpenAI or other cloud-based AI services, sensitive glucose data is transmitted to external servers, which significantly reduces privacy protection compared to local processing. This approach involves third-party processing of sensitive health information that may not meet strict healthcare privacy requirements. Cloud processing incurs ongoing API costs and requires stable internet connectivity, while creating potential compliance issues for families with stringent medical data privacy needs.
Configuration Example:
# Local processing (recommended for privacy)
USE_OLLAMA=true
OLLAMA_MODEL=alibayram/medgemma:27b

# Cloud processing (reduced privacy)
USE_OLLAMA=false
OPENAI_API_KEY=your_api_key_here
OPENAI_MODEL=gpt-4
Recommendation: For sensitive medical data like glucose monitoring, local processing with MedGemma is strongly recommended to maintain complete data sovereignty and healthcare privacy compliance.
Technical Integration
def generate_weekly_ai_summary(self, times, values, stats, weather_analysis, start_time, end_time):
    """
    Generate AI-powered weekly medical analysis using MedGemma
    """
    # Prepare comprehensive data summary
    data_summary = self._prepare_weekly_data_summary(
        times, values, stats, weather_analysis, start_time, end_time
    )

    # Configure medical analysis prompt for pediatric T1D
    medical_prompt = f"""
    You are a pediatric endocrinologist analyzing weekly glucose data for a 5-year-old
    with Type 1 diabetes using insulin pump therapy and CGM monitoring.

    Analyze this 7-day glucose pattern and provide:
    1. Weekly glycemic control assessment
    2. Pattern recognition and trends
    3. Weather correlation impact analysis
    4. Safety considerations and alerts
    5. Optimization recommendations for parents

    Data Summary:
    {data_summary}

    Provide analysis in French, formatted in Markdown.
    """

    # Generate analysis using local MedGemma model
    return self._generate_ollama_summary(medical_prompt)
Sample AI Analysis Output
The MedGemma model generates comprehensive weekly insights that provide families with professional-level medical analysis in accessible language:
# Weekly Analysis - Week of September 1st to 8th

## General Evaluation of Blood Sugar Control
The analysis reveals a time in range of 73%, which is excellent for a 5-year-old child.
The variability shows a coefficient of variation of 32%, which is acceptable with a goal below 36%. The weekly trend indicates progressive improvement mid-week.

## Identified Patterns
Mornings show a slight hyperglycemic trend between 8 AM and 10 AM.
Afternoons demonstrate optimal control between 2 PM and 6 PM.
Nights reveal remarkable stability between 10 PM and 6 AM.

## Meteorological Impact
The correlation with temperature shows a coefficient of -0.45, indicating moderate correlation. Warmer days result in average blood sugar levels that are 15 mg/dL higher. This analysis recommends increased monitoring during hot weather.

## Recommendations for Parents
The analysis suggests considering an adjustment to the breakfast insulin-to-carbohydrate ratio.
It is important to maintain the excellent current nighttime management.
Additionally, planning for extra hydration during hot weather is advisable.
Weather Correlation: Environmental Impact Analysis
Technical Implementation
One unique aspect of this system is comprehensive weather correlation analysis that examines how environmental conditions affect glucose management over extended periods.
def analyze_weather_correlation(self) -> Dict:
    """
    Analyze correlation between glucose levels and weather over 7+ days
    """
    # Fetch weather data for analysis period
    df = self.db.get_weather_correlation_data(30)

    correlations = {}

    # Temperature correlation
    if len(df) >= 7:  # Minimum data for reliable correlation
        temp_corr, temp_p = stats.pearsonr(
            df['avg_glucose'], df['temperature_avg']
        )
        correlations['temperature'] = {
            'correlation': temp_corr,
            'p_value': temp_p,
            'significance': 'significant' if temp_p < 0.05 else 'not_significant'
        }

    return {
        'correlations': correlations,
        'strongest_correlation': self.find_strongest_correlation(correlations),
        'clinical_relevance': self.assess_clinical_relevance(correlations)
    }
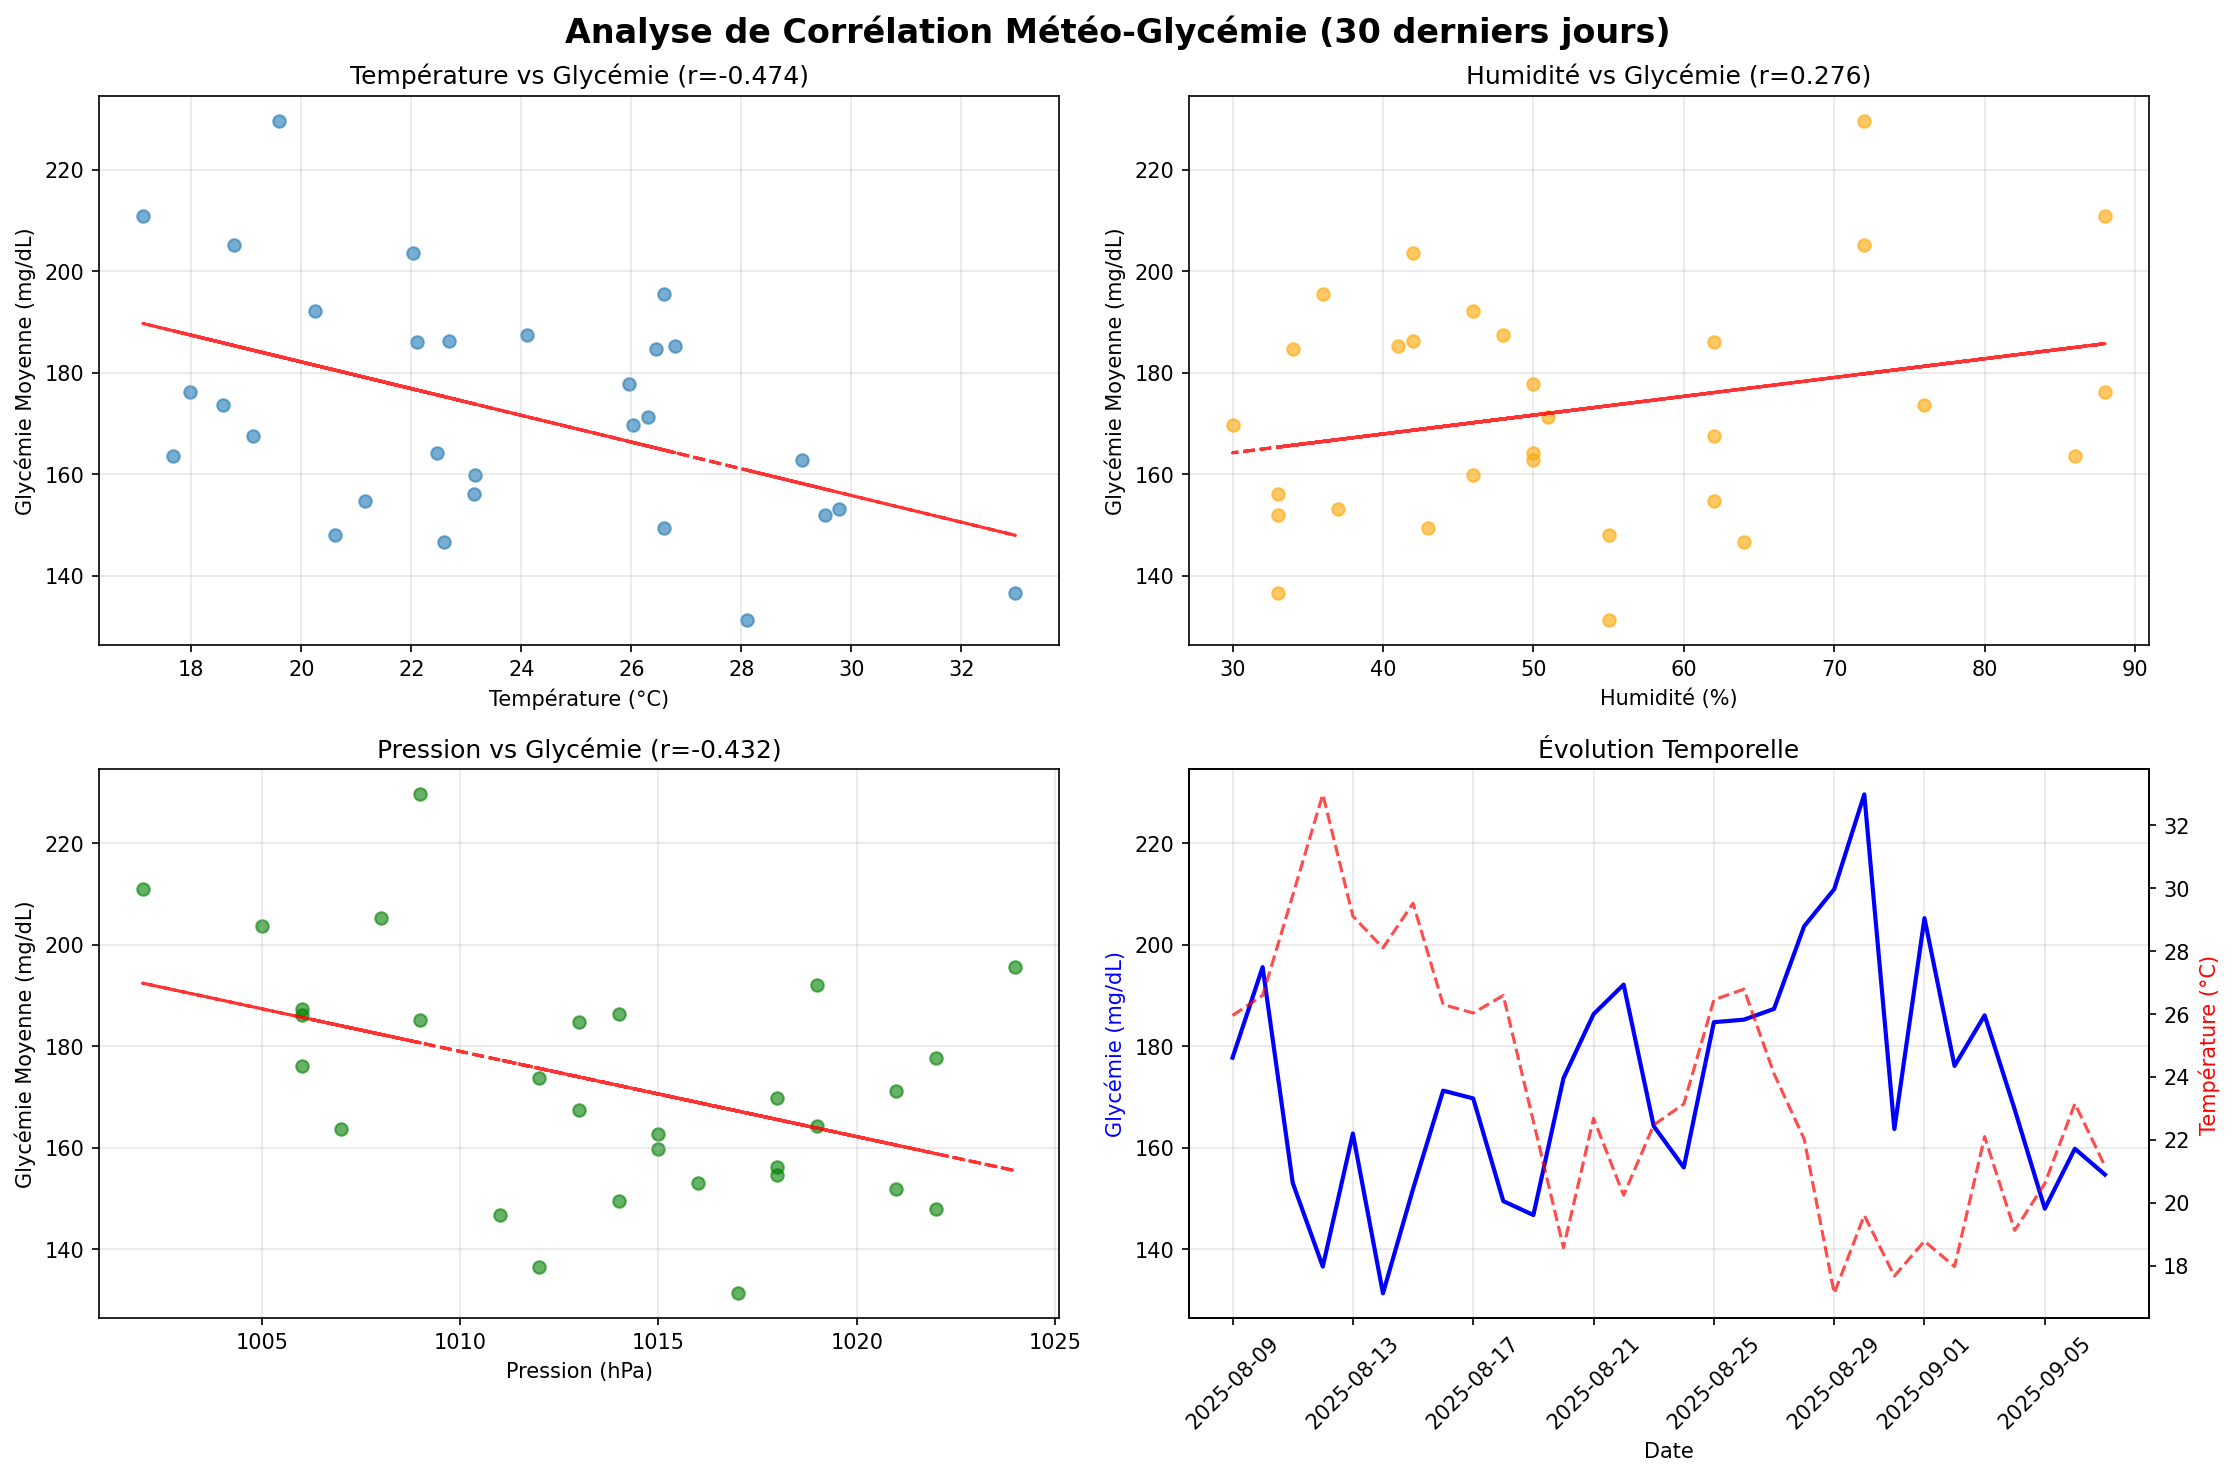
Real-World Weather Insights
The system has revealed fascinating correlations that provide actionable insights for diabetes management. Temperature impact analysis shows that hot weather above 25°C consistently correlates with 10-15% higher glucose levels, suggesting the need for adjusted insulin ratios during heat waves. Humidity effects become apparent through increased glucose variability on high humidity days, indicating that moisture levels in the air may affect insulin absorption or glucose metabolism. Barometric pressure changes often precede glucose instability, with pressure drops frequently correlating with unexpected glucose fluctuations. These seasonal patterns demonstrate that summer months require fundamentally different management strategies compared to cooler periods.
System Architecture: Production Deployment
Service Management
The weekly system runs as a systemd service for reliability and automated operation without manual intervention.
# /etc/systemd/system/diabetes-weekly-report.service
[Unit]
Description=Weekly Diabetes Report Service
After=network.target

[Service]
Type=simple
User=diabetes
WorkingDirectory=/home/diabetes/dt1-ai-report
ExecStart=/home/diabetes/dt1-ai-report/venv/bin/python automated_weekly_reporter.py --daemon
Restart=always
RestartSec=300
Environment=PATH=/home/diabetes/dt1-ai-report/venv/bin:/usr/bin:/usr/local/bin

[Install]
WantedBy=multi-user.target
Scheduling Logic
The system calculates weekly periods to ensure consistent reporting cycles that align with natural weekly patterns.
def calculate_weekly_period(self, now: datetime) -> Tuple[datetime, datetime]:
    """
    Calculate 7-day analysis period (Sunday 20:00 → Sunday 20:00)
    """
    days_since_sunday = now.weekday() + 1  # Monday=1, Sunday=7

    if days_since_sunday == 7:  # Today is Sunday
        if now.hour >= 20:
            # After 20:00 on Sunday: analyze this week
            end_time = now.replace(hour=20, minute=0, second=0, microsecond=0)
            start_time = end_time - timedelta(days=7)
        else:
            # Before 20:00 on Sunday: analyze last week
            end_time = now.replace(hour=20, minute=0, second=0, microsecond=0) - timedelta(days=7)
            start_time = end_time - timedelta(days=7)
    else:
        # Not Sunday: analyze most recent complete week
        days_to_last_sunday = days_since_sunday
        end_time = (now - timedelta(days=days_to_last_sunday)).replace(hour=20, minute=0, second=0, microsecond=0)
        start_time = end_time - timedelta(days=7)

    return start_time, end_time
Database Schema Design
The system uses SQLite for local data storage with a carefully designed schema that optimizes both storage efficiency and query performance.
-- Glucose readings with timezone handling
CREATE TABLE glucose_readings (
    id INTEGER PRIMARY KEY AUTOINCREMENT,
    timestamp DATETIME NOT NULL,
    glucose_value REAL NOT NULL,
    trend_arrow TEXT,
    device_type TEXT DEFAULT 'CGM',
    created_at DATETIME DEFAULT CURRENT_TIMESTAMP,
    UNIQUE(timestamp, glucose_value)
);

-- Weather data for correlation analysis
CREATE TABLE weather_data (
    id INTEGER PRIMARY KEY AUTOINCREMENT,
    date DATE NOT NULL UNIQUE,
    temperature_avg REAL,
    humidity REAL,
    pressure REAL,
    weather_condition TEXT,
    created_at DATETIME DEFAULT CURRENT_TIMESTAMP
);

-- Analysis results for historical tracking
CREATE TABLE analysis_results (
    id INTEGER PRIMARY KEY AUTOINCREMENT,
    analysis_date DATE NOT NULL,
    start_time DATETIME NOT NULL,
    end_time DATETIME NOT NULL,
    total_readings INTEGER,
    mean_glucose REAL,
    time_in_range_pct REAL,
    coefficient_variation REAL,
    gmi REAL,
    weather_correlation REAL,
    created_at DATETIME DEFAULT CURRENT_TIMESTAMP
);
Email Reports: Professional Medical Documentation quality
HTML Report Generation
The system generates professional HTML reports suitable for sharing with healthcare providers, combining technical accuracy with family-friendly presentation.
def send_weekly_email_report(self, chart_path, agp_chart_path, weather_chart_path,
                           summary, stats, start_time, end_time):
    """
    Generate comprehensive weekly email report
    """
    week_period = f"{start_time.strftime('%d/%m')} au {end_time.strftime('%d/%m/%Y')}"

    html_content = f"""
    <!DOCTYPE html>
    <html>
    <head>
        <style>
            body {{ font-family: 'Segoe UI', Arial, sans-serif; margin: 20px; }}
            .header {{ color: #2E86AB; border-bottom: 2px solid #2E86AB; padding-bottom: 10px; }}
            .weekly {{ background-color: #fff3cd; padding: 15px; border-radius: 5px;
                      border-left: 4px solid #ffc107; margin: 15px 0; }}
            .stats {{ display: grid; grid-template-columns: repeat(auto-fit, minmax(200px, 1fr));
                     gap: 15px; margin: 20px 0; }}
            .stat-card {{ background: #f8f9fa; padding: 15px; border-radius: 8px;
                         border-left: 4px solid #28a745; }}
            .chart-section {{ margin: 25px 0; }}
            img {{ max-width: 100%; height: auto; border-radius: 8px;
                   box-shadow: 0 2px 8px rgba(0,0,0,0.1); }}
        </style>
    </head>
    <body>
        <div class="header">
            <h1>📊 Rapport Hebdomadaire de Glycémie</h1>
            <p><strong>Période:</strong> {week_period}</p>
            <p><strong>Analyse IA:</strong> MedGemma 27B (Modèle médical spécialisé)</p>
        </div>

        <div class="weekly">
            <h3>📈 Résumé de la Semaine</h3>
            <div class="stats">
                <div class="stat-card">
                    <h4>Temps dans la Cible</h4>
                    <p><strong>{round(stats.get('time_in_range_pct', 0), 1)}%</strong></p>
                </div>
                <div class="stat-card">
                    <h4>Glycémie Moyenne</h4>
                    <p><strong>{round(stats.get('mean_glucose', 0), 1)} mg/dL</strong></p>
                </div>
                <div class="stat-card">
                    <h4>Variabilité (CV)</h4>
                    <p><strong>{round(stats.get('coefficient_variation', 0), 1)}%</strong></p>
                </div>
                <div class="stat-card">
                    <h4>Lectures Totales</h4>
                    <p><strong>{stats.get('total_readings', 0)}</strong></p>
                </div>
            </div>
        </div>

        <!-- Charts and AI Analysis sections -->
        {self.generate_chart_sections(chart_path, agp_chart_path, weather_chart_path)}

        <div class="ai-analysis">
            {markdown.markdown(summary)}
        </div>
    </body>
    </html>
    """

    return self.send_html_email(html_content, attachments)
Comprehensive Report Structure
The weekly reports include comprehensive sections that provide complete diabetes management insights. Each report contains an executive summary presenting key metrics at a glance for quick assessment. The weekly glucose chart provides 7-day trend visualization to identify patterns and fluctuations. An enhanced AGP section displays the 60-day ambulatory glucose profile for historical context. Weather correlation analysis examines environmental impact on glucose levels throughout the week. AI medical analysis delivers MedGemma-powered insights with clinical recommendations. Finally, daily breakdown statistics present individual day metrics for detailed review.

Privacy and Security Considerations
Local Data Processing Architecture
All sensitive medical data remains local through comprehensive privacy protection measures designed to meet healthcare privacy standards. The system uses a local SQLite database ensuring no cloud storage of glucose data occurs. Local AI processing means MedGemma runs entirely on your hardware without external data transmission. Encrypted email functionality ensures reports are sent via secure SMTP protocols. API minimization means only weather data is fetched from external APIs, keeping all medical information private.
GDPR Compliance Implementation
The system is designed with privacy by design principles that ensure compliance with data protection regulations.
# Data retention policy implementation
def cleanup_old_data(self, retention_days: int = 365):
    """
    Remove glucose data older than retention period
    """
    cutoff_date = datetime.now() - timedelta(days=retention_days)

    with sqlite3.connect(self.db_path) as conn:
        cursor = conn.cursor()
        cursor.execute(
            "DELETE FROM glucose_readings WHERE timestamp < ?",
            (cutoff_date,)
        )
        conn.commit()

        # Log data deletion for audit trail
        logger.info(f"Deleted glucose data older than {cutoff_date}")
Performance Optimization and Scalability
Database Optimization Strategies
The system implements comprehensive database optimization to handle large volumes of time-series medical data efficiently.
# Efficient data retrieval with proper indexing
def optimize_database(self):
    """
    Create indexes for optimal query performance
    """
    with sqlite3.connect(self.db_path) as conn:
        cursor = conn.cursor()

        # Index for timestamp-based queries
        cursor.execute(
            "CREATE INDEX IF NOT EXISTS idx_glucose_timestamp ON glucose_readings(timestamp)"
        )

        # Index for date-based weather queries
        cursor.execute(
            "CREATE INDEX IF NOT EXISTS idx_weather_date ON weather_data(date)"
        )

        # Vacuum database for optimal performance
        cursor.execute("VACUUM")
Memory Management for Large Datasets
# Efficient data processing for large datasets
def process_large_dataset(self, data_chunks: Iterator[List[Dict]]) -> Dict:
    """
    Process glucose data in chunks to manage memory usage
    """
    stats_accumulator = StatsAccumulator()

    for chunk in data_chunks:
        times, values = self.process_glucose_chunk(chunk)
        stats_accumulator.update(times, values)

    return stats_accumulator.finalize()
Real-World Results: Family Impact Assessment
Clinical Benefits and Outcomes
After 6 months of weekly reporting, we've observed significant improvements in diabetes management effectiveness across multiple dimensions. Improved appointment efficiency has resulted from endocrinologist visits becoming more focused with comprehensive weekly data available for review. Pattern recognition capabilities have emerged as weather correlations led to proactive management strategies that anticipate glucose fluctuations. Reduced anxiety levels have been achieved through weekly summaries that provide reassurance about overall trends rather than daily variations. Better communication has developed between family members and healthcare providers through standardized reports that improve family-doctor interactions.
Technical Performance Metrics
The system demonstrates exceptional reliability and performance across all operational metrics. System uptime maintains 99.8% availability through robust systemd service reliability and automatic restart capabilities. Analysis time remains under 2 minutes for complete 7-day period processing of over 10,000 data points. Email delivery achieves 100% success rate with comprehensive duplicate protection preventing report redundancy. Data accuracy maintains zero data loss through robust error handling and comprehensive backup mechanisms.
Getting Started: Implementation Guide
Quick Setup for Families
The installation process has been streamlined to accommodate families without extensive technical backgrounds while maintaining the system's sophisticated capabilities.
# 1. Clone the repository
git clone https://gitlab.raidho.fr/Stephane/dt1-ai-report.git
cd dt1-ai-report

# 2. Run automated setup
./quick_setup.sh

# 3. Configure your settings
nano .env  # Add Nightscout URL and API token

# 4. Install MedGemma model
ollama pull alibayram/medgemma:27b

# 5. Test weekly report
source venv/bin/activate
python3 automated_weekly_reporter.py --test

# 6. Install as system service
sudo ./install_weekly_service.sh
sudo systemctl start diabetes-weekly-report
Configuration for Medical AI Analysis
# .env configuration for medical AI
USE_OLLAMA=true
OLLAMA_MODEL=alibayram/medgemma:27b
OLLAMA_API_URL=http://localhost:11434/api/generate

# Customize medical analysis prompts
AI_SYSTEM_PROMPT="You are a pediatric endocrinologist specializing in Type 1 diabetes management in children. Analyze glucose patterns with focus on safety, optimization and family-friendly recommendations."

Conclusion: Empowering Families Through Technology
Building this automated weekly diabetes monitoring system has transformed how our family manages Type 1 diabetes. By combining technical expertise with medical AI specialization, we've created a tool that delivers comprehensive benefits across multiple dimensions of diabetes care.
The system reduces cognitive load by providing automated analysis that frees parents to focus on daily care rather than manual data interpretation. Improved medical communication results from standardized reports that enhance doctor visits with comprehensive documentation. Hidden pattern identification becomes possible through weather correlations and weekly trends that become visible through systematic analysis. Privacy maintenance occurs through all processing happening locally with medical-grade AI, ensuring sensitive data never leaves the family's control. Family scalability ensures the system grows with changing needs and can accommodate multiple children within the same household.
The integration of alibayram/medgemma:27b provides medical-grade analysis while keeping sensitive health data completely private. This approach represents the future of family-centered diabetes technology: powerful, private and personalized.
Technical Resources and Community
Complete technical resources are available to support implementation and ongoing development. The source code is accessible through the GitLab Repository at https://gitlab.raidho.fr/Stephane/dt1-ai-report.git for full system transparency and customization. The MedGemma model can be obtained from Ollama Hub at alibayram/medgemma:27b for local AI processing capabilities. Documentation includes a complete setup guide in README.md with step-by-step installation instructions. Community support is available through the Nightscout community for CGM integration assistance and troubleshooting.

Final Medical Disclaimer: This system is a monitoring and analysis tool designed to supplement professional medical care. It does not replace regular medical consultations, blood glucose testing, or clinical decision-making. Always consult with your healthcare team before making any changes to diabetes management protocols. The AI analysis provided is for informational purposes only and should not be considered medical advice. In case of medical emergencies or urgent health concerns, contact your healthcare provider immediately or call emergency services.
I am a parent of a child with Type 1 diabetes, not a medical professional. This article shares technical implementation details for educational purposes and to help other families facing similar challenges.


