HAProxy Comprehensive HAProxy High Availability Monitoring with Grafana and Prometheus 
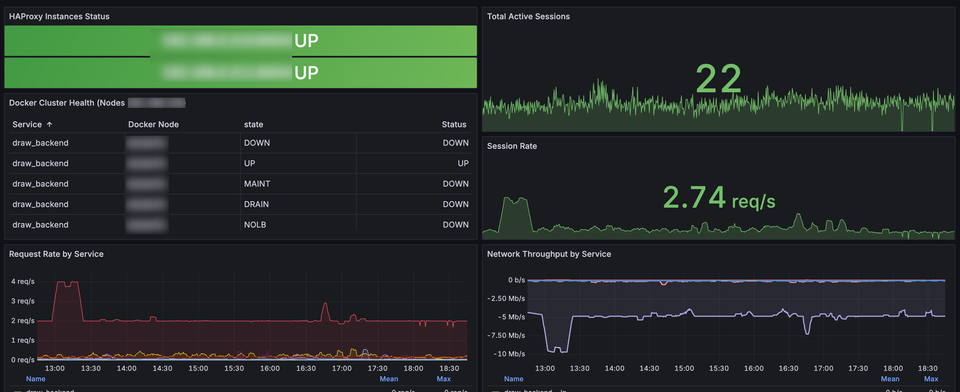
Complete HAProxy HA monitoring using Prometheus and Grafana. Custom dashboard with eight panels covering instance health, throughput and error rates. Includes automated alerts for critical failures. Stephane Thirion 1 Sep 2025 · 5 min read
Docker Building a Monitoring Stack on Docker Swarm with Prometheus, Grafana, and InfluxDB Monitoring environments is critical for maintaining the performance and reliability of modern applications. This blog post details the setup of a monitoring stack in Docker Swarm using Prometheus, Grafana, and InfluxDB. We'll focus on a practical example using NFS for shared storage... Stephane Thirion 25 Dec 2024 · 3 min read