
Mastering Citrix DaaS Observability: The Ultimate Technical Stack
When I first dove into monitoring Citrix DaaS at scale, I quickly learned that the standard go-to - Citrix Monitor / Director - leaves you scrambling for insights. It can't give you the long-term trends, cross-customer correlations, or deep performance analysis you need. The only way to truly own the telemetry is to build it yourself. Below is the full blueprint of the stack I've assembled, running with Python, InfluxDB, and Grafana.

1. The Harvester: Python and Multi-Tenant OData API
The "harvester" is a Python script that polls the Citrix Monitor API v4 every five minutes. The trickiest part is handling the reliability of the Citrix Cloud Gateway.
Authentication with Azure Fallback
If the regional endpoint throws a 502 or 504, the script automatically fails over to the direct Azure location (api.westeurope), preventing gaps in my charts.
import requests

def get_citrix_token(CLIENT_ID, CLIENT_SECRET, REGION='eu'):
    # Regional gateway (Primary)
    auth_url = f"https://api-{REGION}.cloud.com/cctrustinvite/api/token"
    # Azure WestEurope direct (Fallback)
    fallback_url = "https://api.westeurope.cloud.com/cctrustinvite/api/token"

    payload = {'grant_type': 'client_credentials', 'client_id': CLIENT_ID, 'client_secret': CLIENT_SECRET}

    try:
        r = requests.post(auth_url, data=payload, timeout=12)
        r.raise_for_status()
        return r.json()['access_token']
    except Exception:
        # Prevent downtime of the monitoring itself
        r = requests.post(fallback_url, data=payload, timeout=12)
        return r.json()['access_token']

The OData Query: Leveraging $expand
In a multi-tenant environment, you have to know which connection belongs to which Delivery Group. I use the OData $expand method to join the Machine object and DesktopGroupName in a single call, keeping my data tight and accurate.
def fetch_sessions(token, customer_id):
    endpoint = f"https://api.cloud.com/monitordata/v4/Data/Connections"
    headers = {'Authorization': f'Bearer {token}', 'Citrix-CustomerId': customer_id}
    params = {
        '$top': 100,
        '$select': 'UserName,LogonDuration,StartTime',
        '$expand': 'Machine($select=DesktopGroupName)',
        '$orderby': 'StartTime desc'
    }
    return requests.get(endpoint, headers=headers, params=params).json()['value']
2. Data Storage: InfluxDB and The Line Protocol
I push metrics to InfluxDB using the Line Protocol. Designing tags and fields is critical - I use customer_id and delivery_group as tags so Grafana can index instantly.
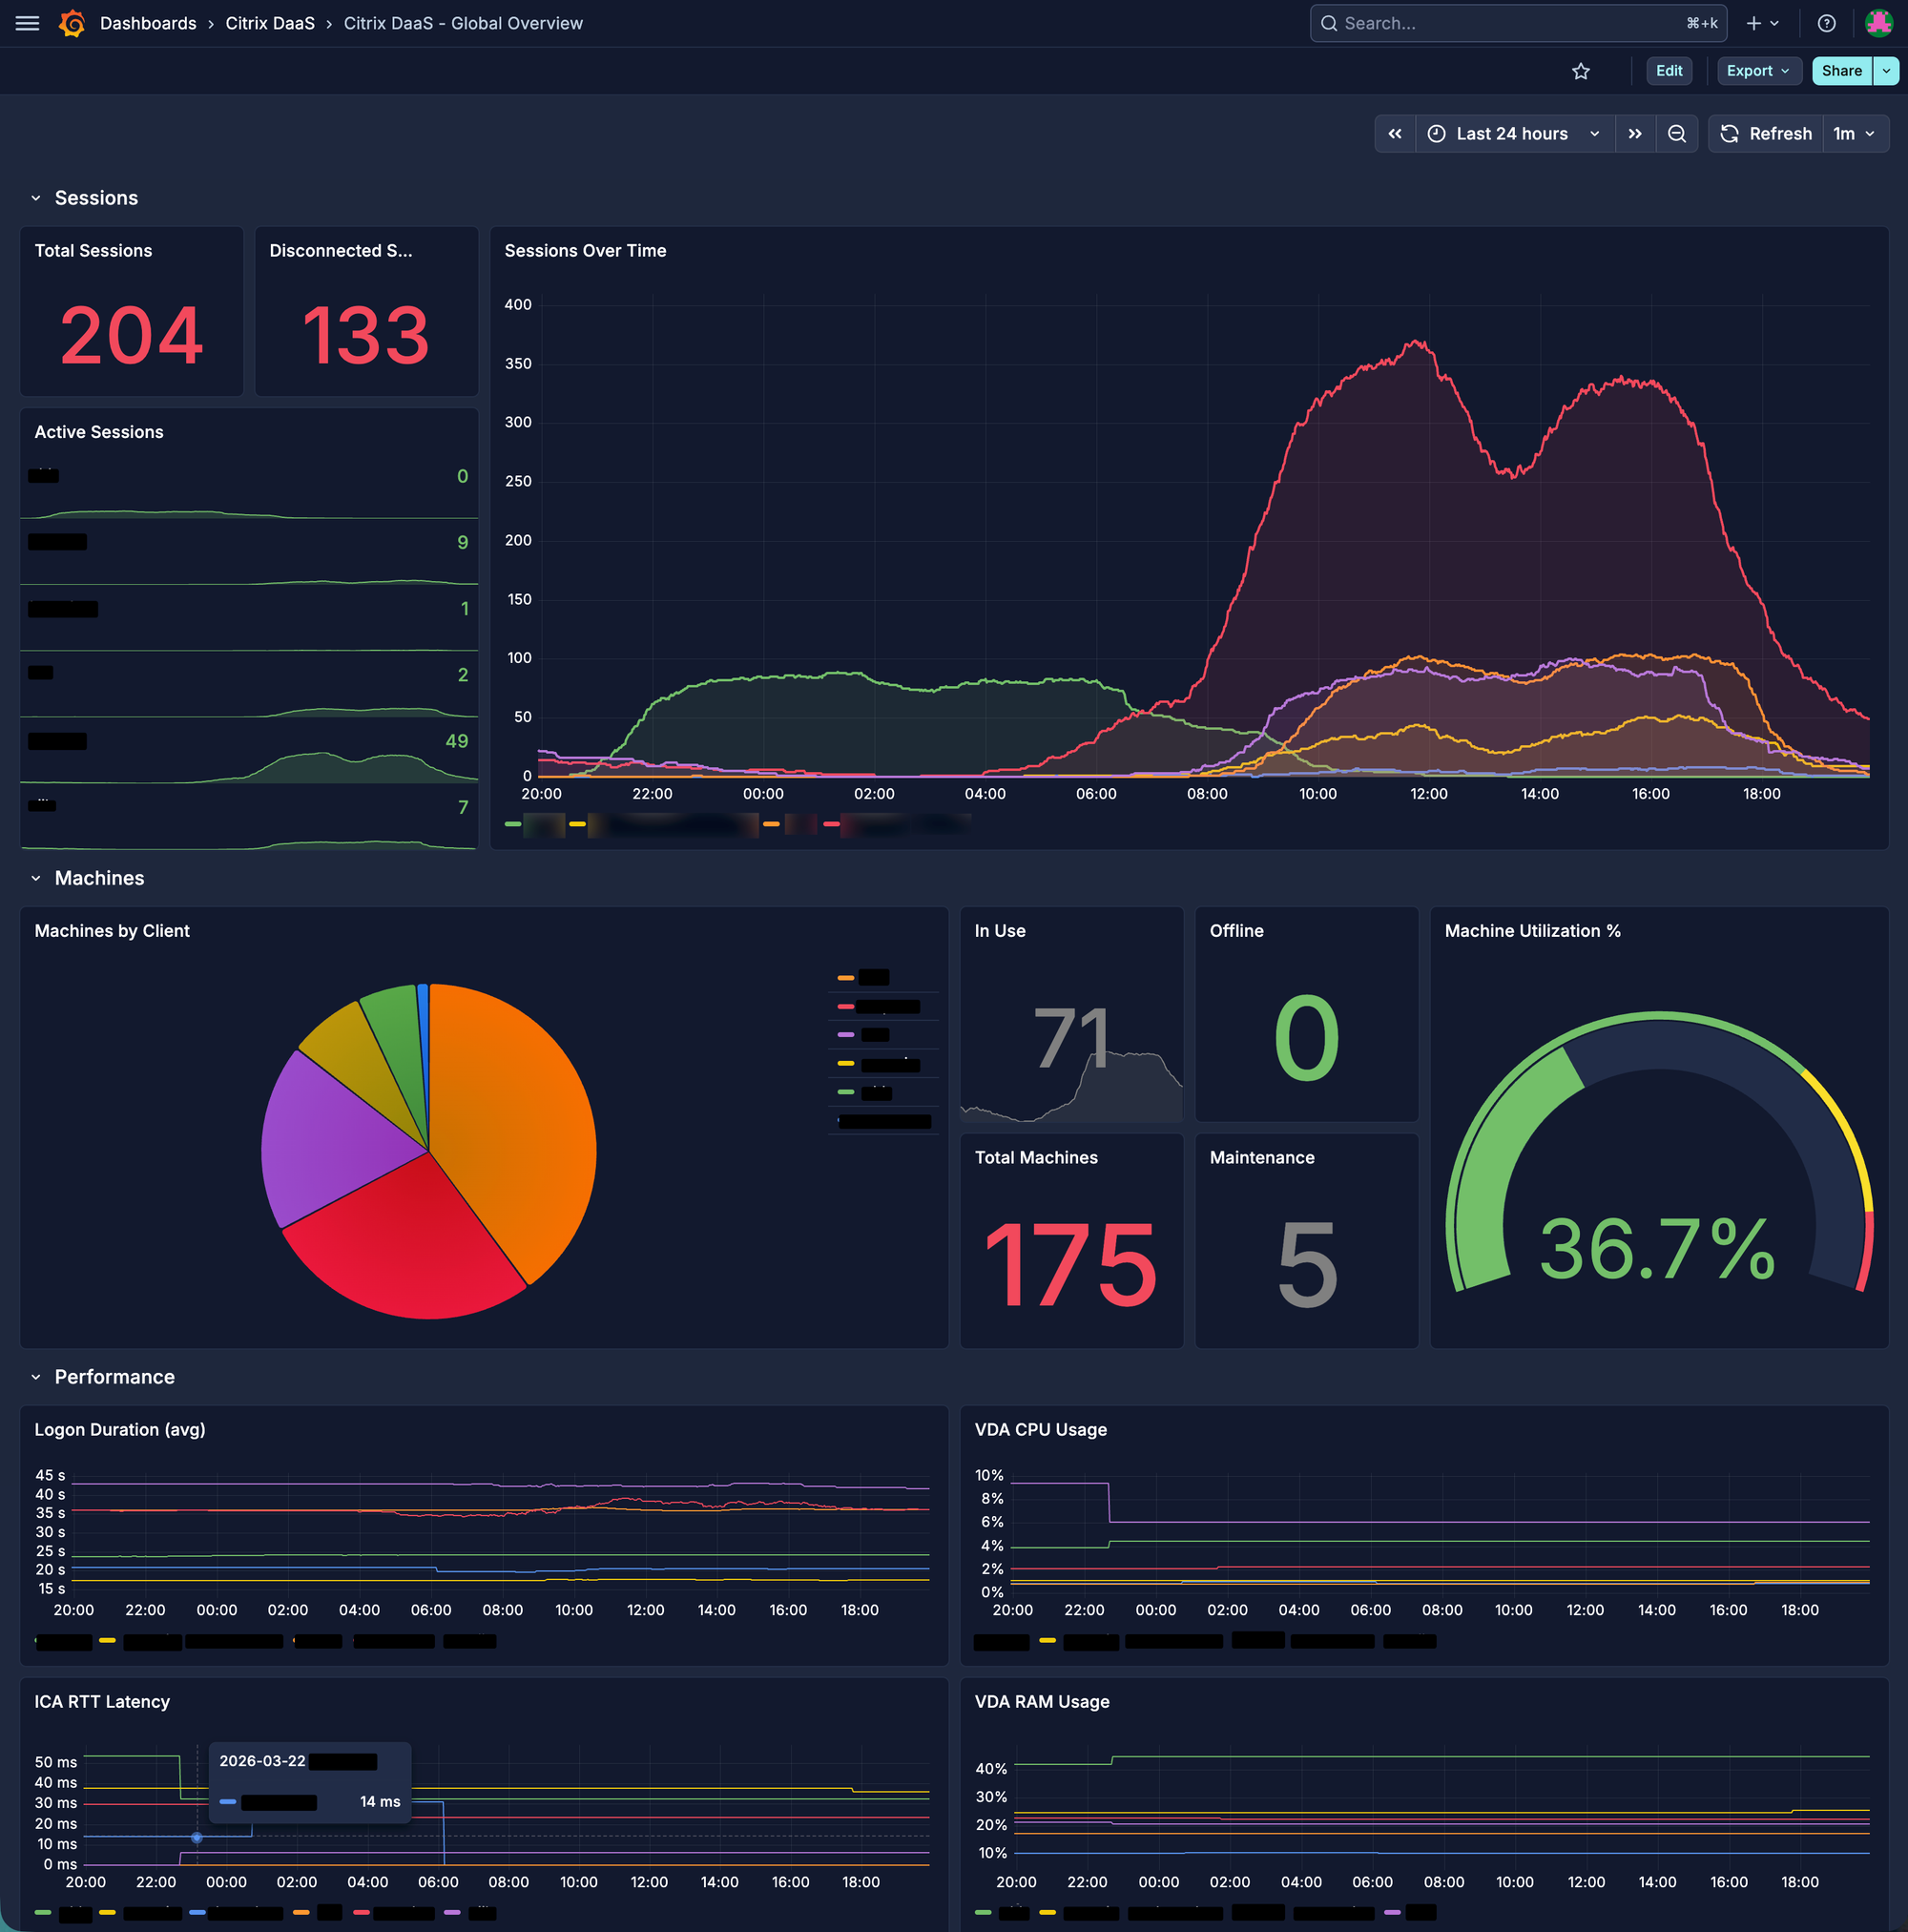
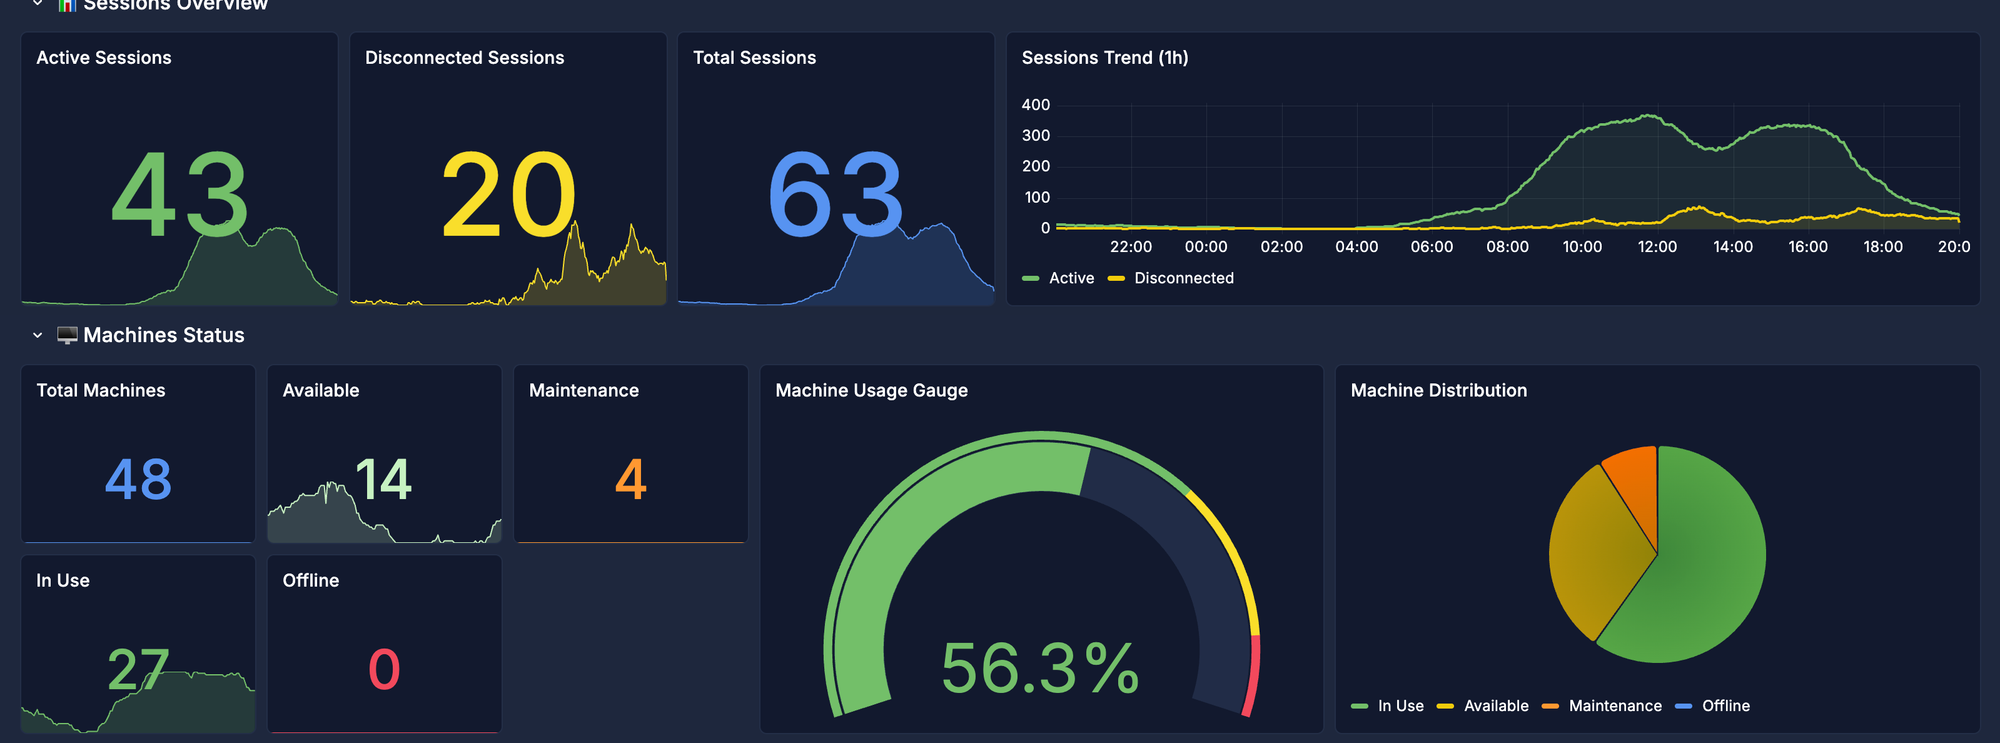
3. The Cockpit: Advanced Grafana Dashboards
Visualization is where the magic happens. I don't just show averages; I display distributions that actually drive decisions.
Heatmap: Identifying the "8:00 AM Rush"
Using Flux, I generate heatmaps that reveal when and where logons cluster beyond acceptable SLAs.
from(bucket: "citrix_metrics")
  |> range(start: v.timeRangeStart, stop: v.timeRangeEnd)
  |> filter(fn: (r) => r._measurement == "citrix_logon")
  |> filter(fn: (r) => r.customer == "${Customer:text}")
  |> aggregateWindow(every: 1m, column: "_value", fn: mean)
Conclusion: From Reactive to Proactive
Incidents are inevitable, but with this stack I turn from feeling slow to seeing the lag before it hurts. Owning the telemetry through this Python/Grafana architecture gives me the historical correlation and visibility I need to operate at a professional architect level.


