HAProxy is one of those pieces of infrastructure I genuinely trust. It is fast, boring in the best possible way, and brutally effective at moving traffic where it needs to go.
But once your configuration grows beyond a few frontends and backends, reading it becomes a small archaeology project.
You know the information is there. Somewhere. Between the frontend binds, ACLs, backend rules, server checks, and runtime stats. The machine understands it perfectly. The human, less so.
This project is also a continuation of the HAProxy work I have written about before: moving from appliance-style load balancing to a more open HAProxy platform, adding BGP anycast, and then exposing HAProxy through its Data Plane API.
If you want the background pieces, these posts set the stage:
- HAProxy Odyssey: From NetScaler to BGP Anycast
- From Keepalived to BGP Anycast: HAProxy HA on UniFi UDM Pro Max
- From SSH to API: Deploying HAProxy Data Plane API for Automated Load Balancer Management
This dashboard sits on top of that foundation. It is based on HAProxy control-plane APIs, especially the Data Plane API, plus runtime stats for live health.
So I built a small dashboard with one very strict rule, at least for now:
It can observe HAProxy. It cannot change HAProxy.
No edits. No transactions. No reloads. No surprise “oops, production moved” moments. Just a clear, modern, read-only view of what is exposed, where traffic flows, and whether the services behind it are alive.
The problem
HAProxy configuration is precise, but it is not always friendly to browse.
When you operate a pair of HAProxy nodes with multiple frontends, routes, ACLs, backends and servers, the daily questions are usually simple:
- What applications are exposed?
- Which frontend receives the traffic?
- Which rule sends it to which backend?
- Are the servers behind that backend healthy?
- Are both HAProxy nodes in sync?
You can answer all of that from the config and runtime socket, of course. But it takes time, and it is easy to miss something when you are scanning raw text under pressure.
I wanted the dashboard equivalent of opening the hood and immediately seeing where the fuel line goes.
The design constraint: read-only
The dashboard talks to HAProxy using the Data Plane API and runtime statistics, but only for reading.
That constraint matters.
Configuration changes should go through a controlled path: Git, review, automation, reload strategy, rollback. A visual dashboard is great for understanding the system, but I do not want it to become an accidental production editor.
So this project intentionally does not:
- modify HAProxy configuration
- create Data Plane API transactions
- trigger reloads
- delete or disable anything
It is an observability tool, not a control plane editor.
I say “for now” because the technical foundation could support more in the future. The Data Plane API is perfectly capable of managing configuration. But this first version intentionally stops at read-only because I wanted something safe enough to keep open all day.
What the dashboard shows
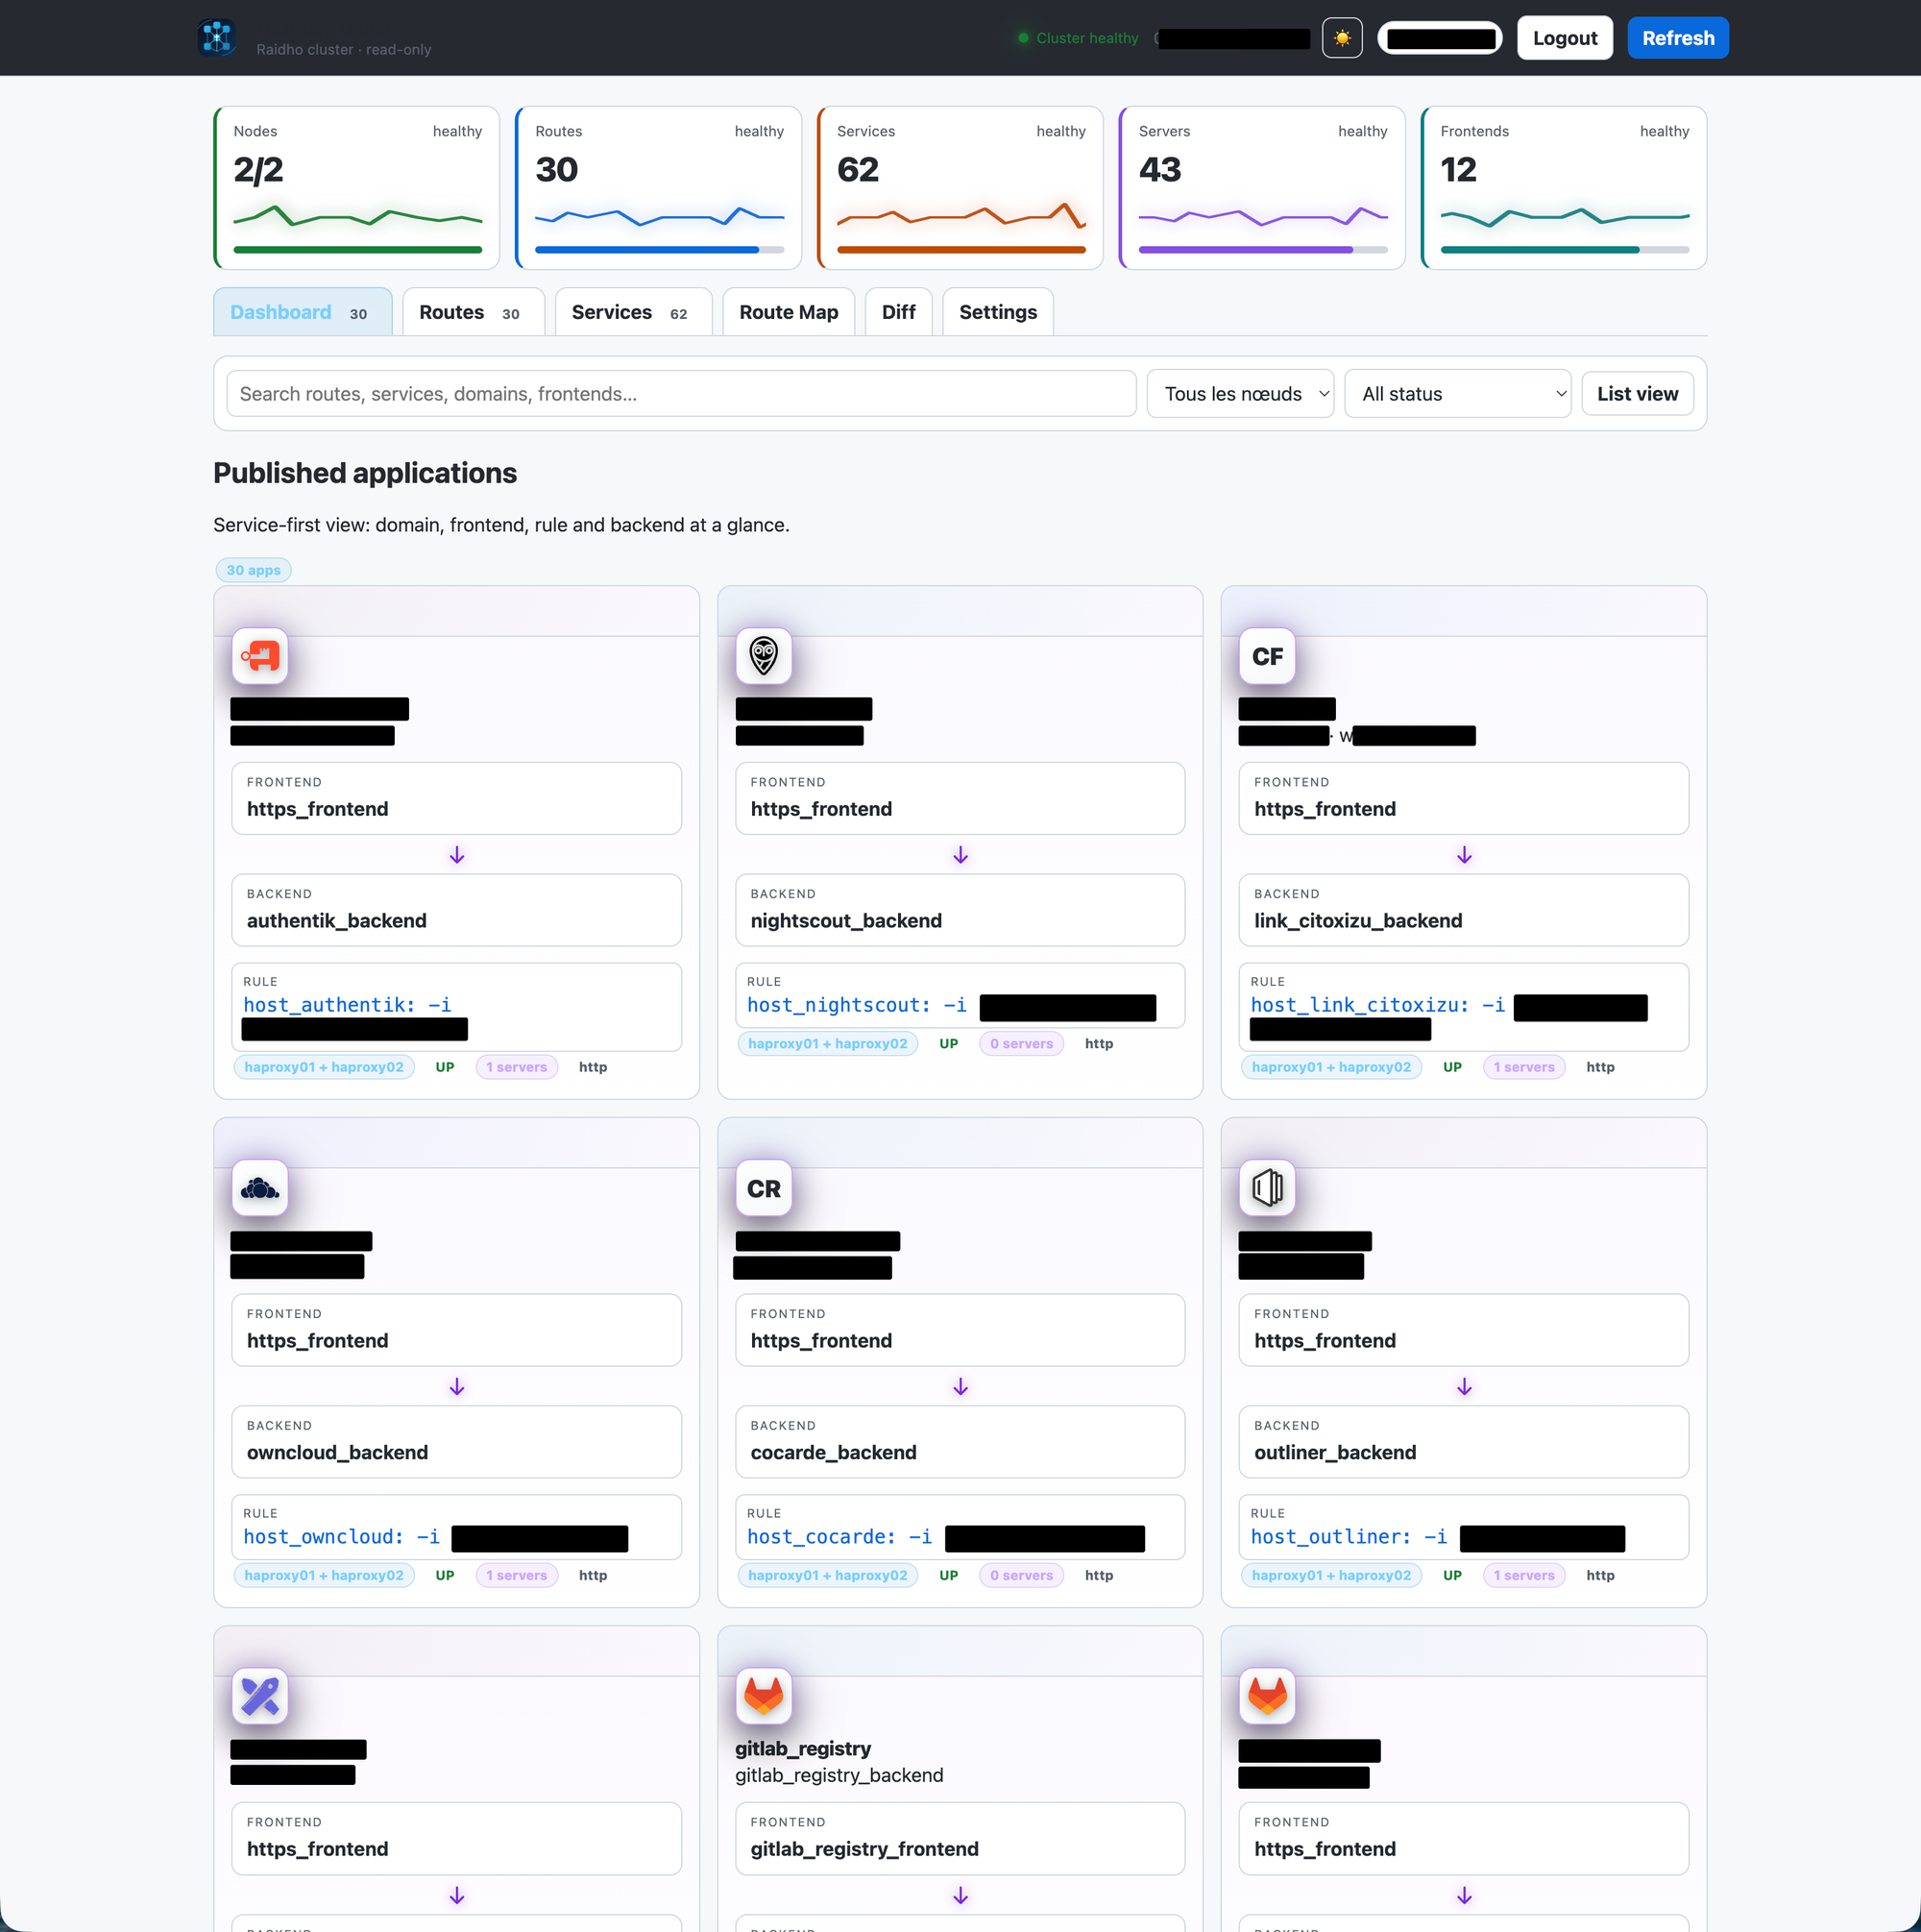
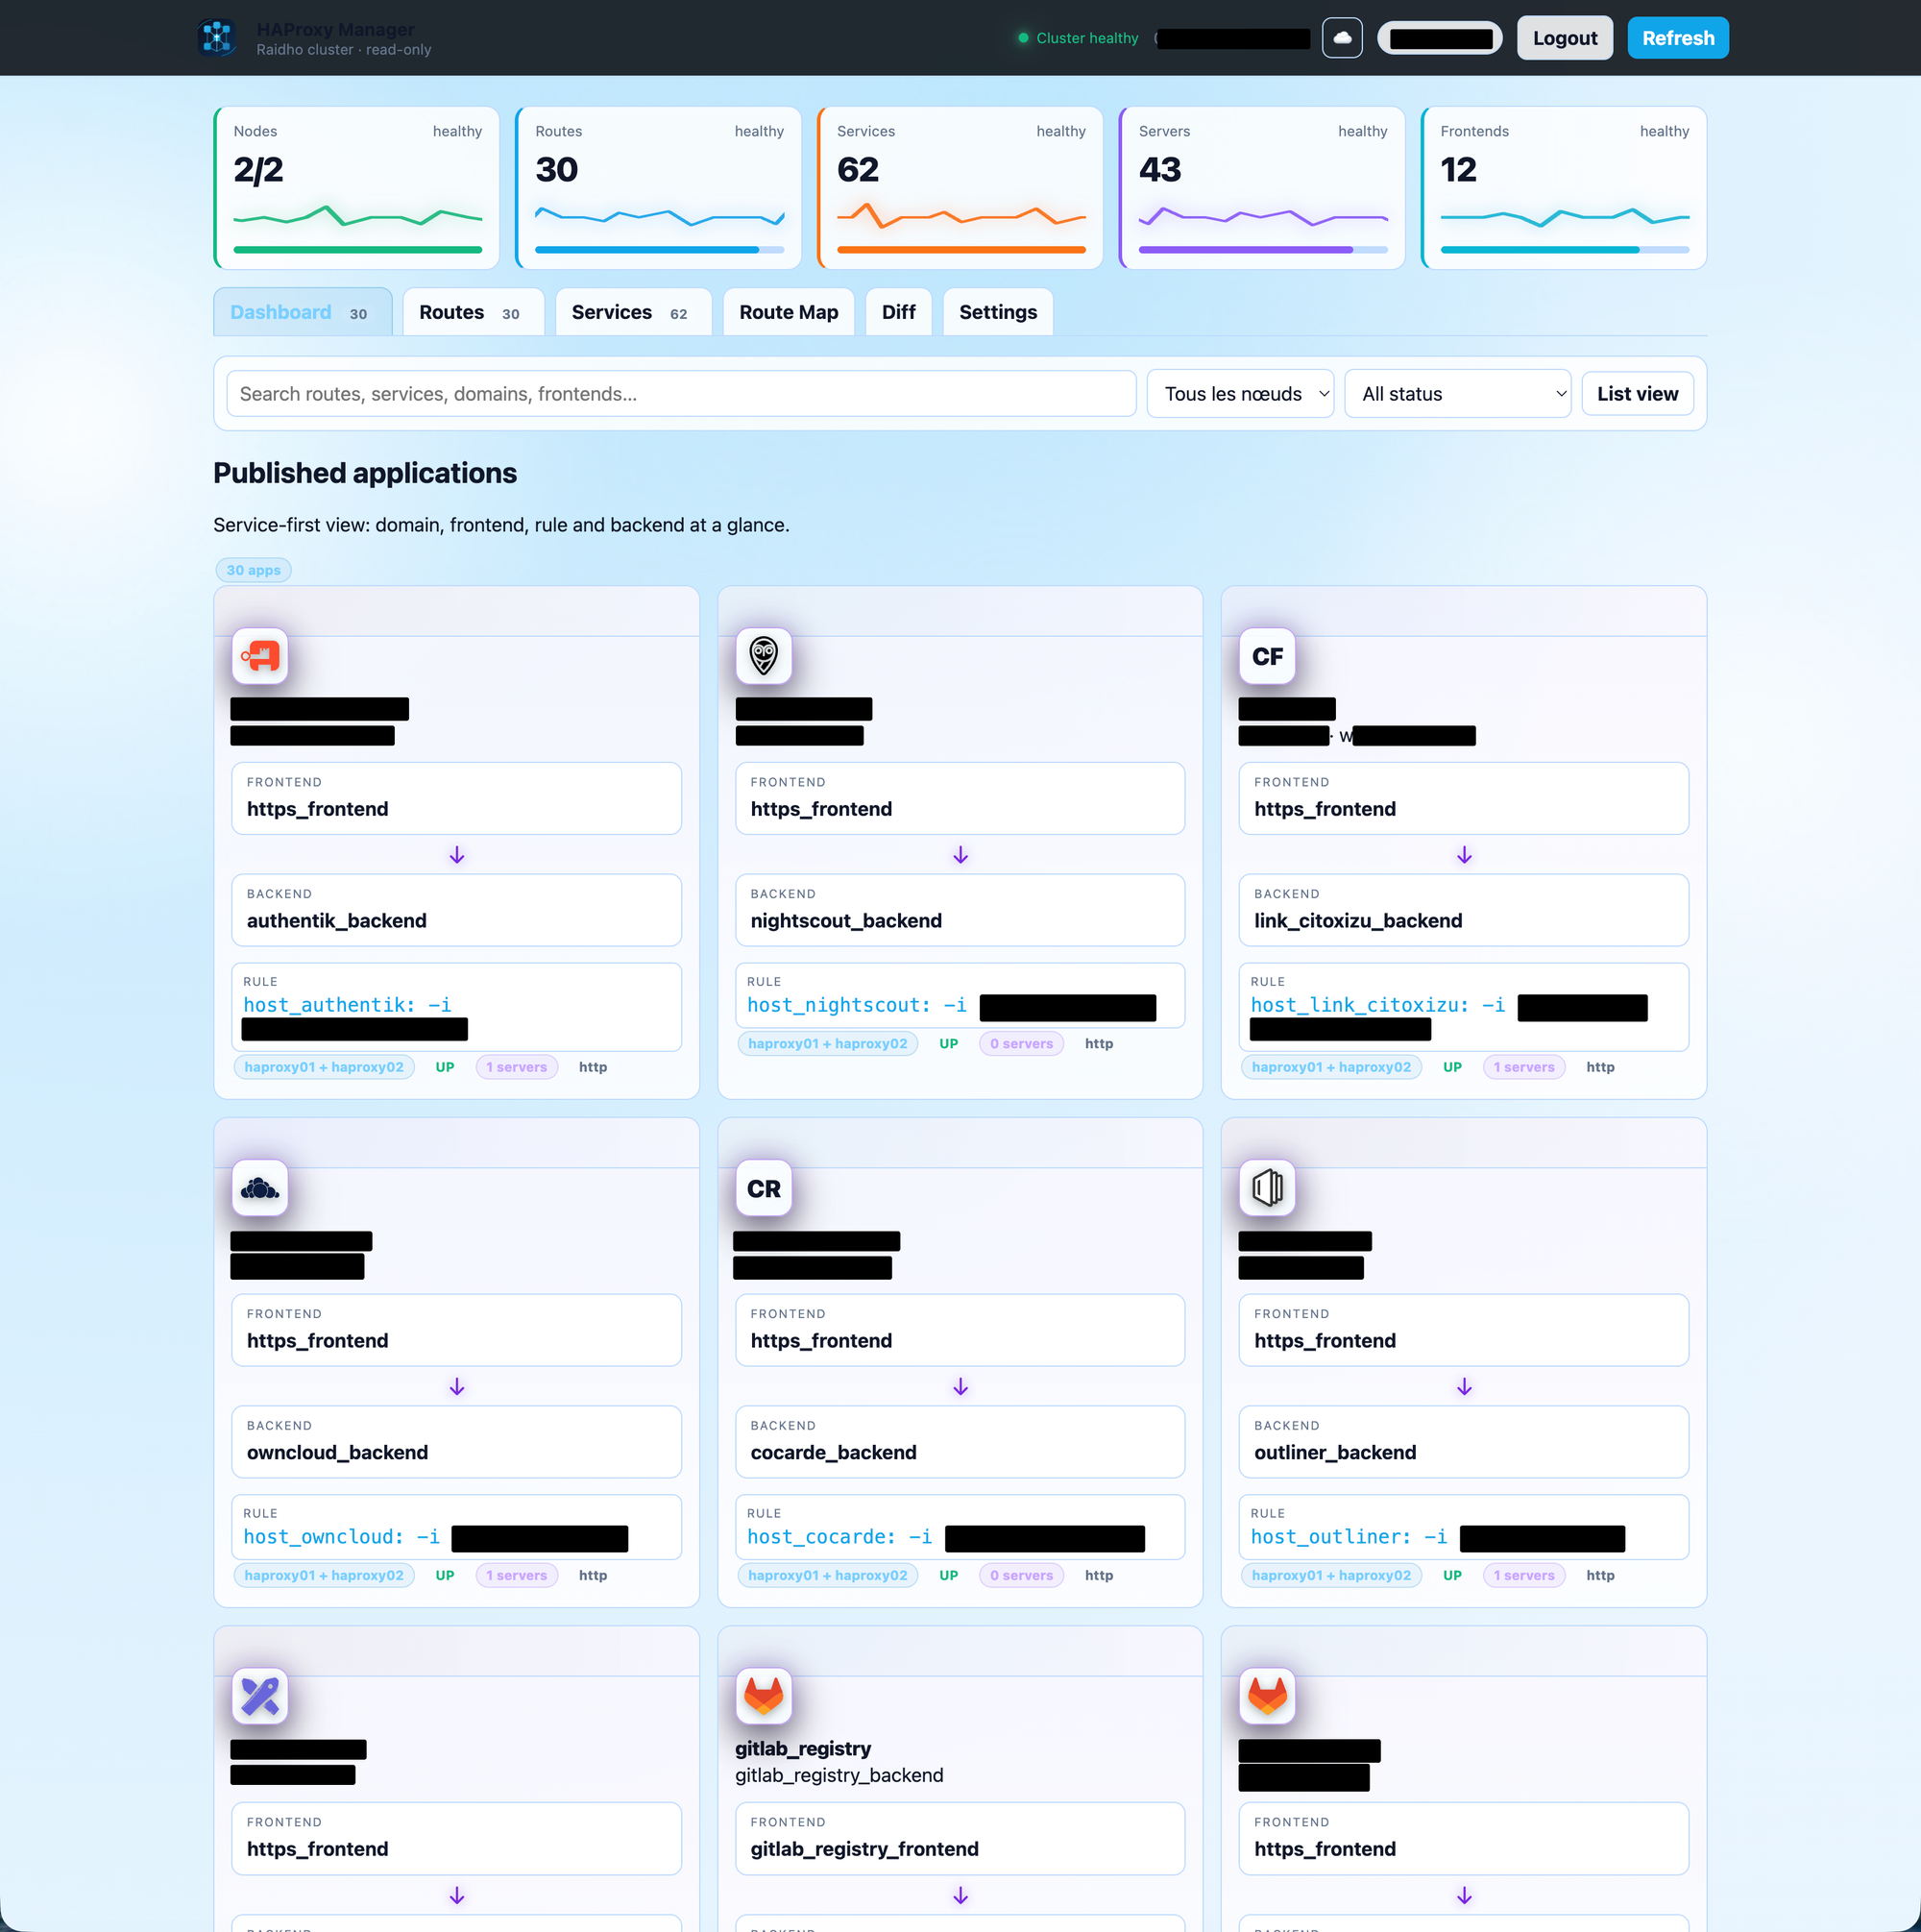
Exposed applications
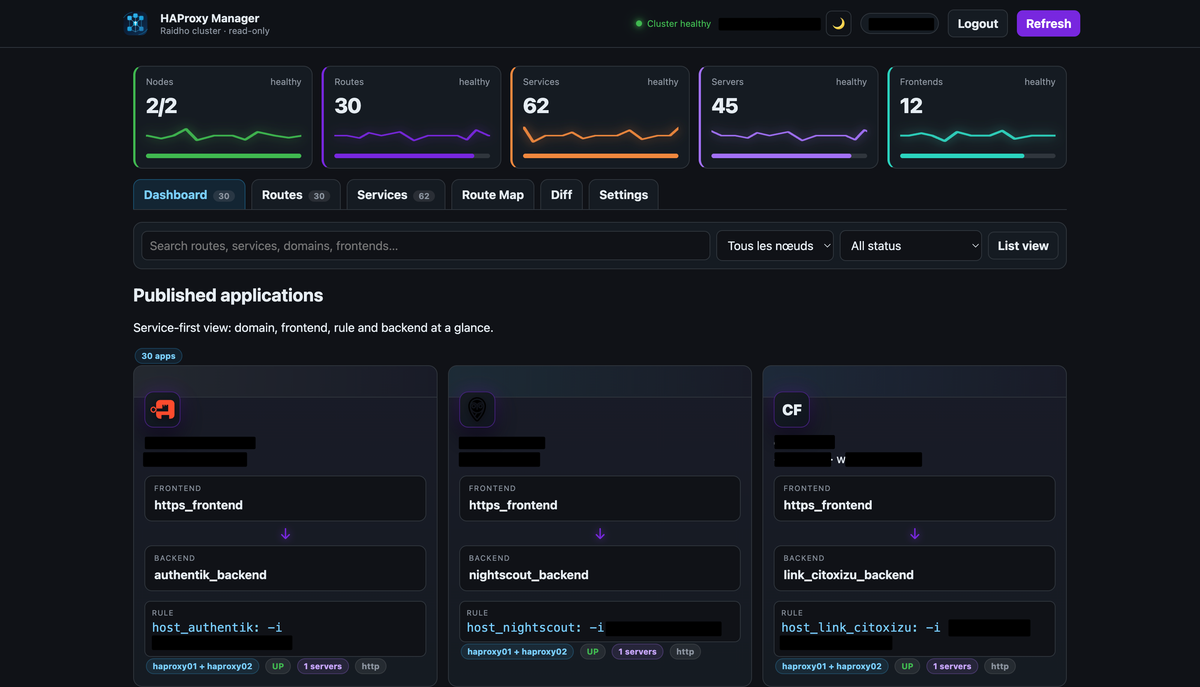
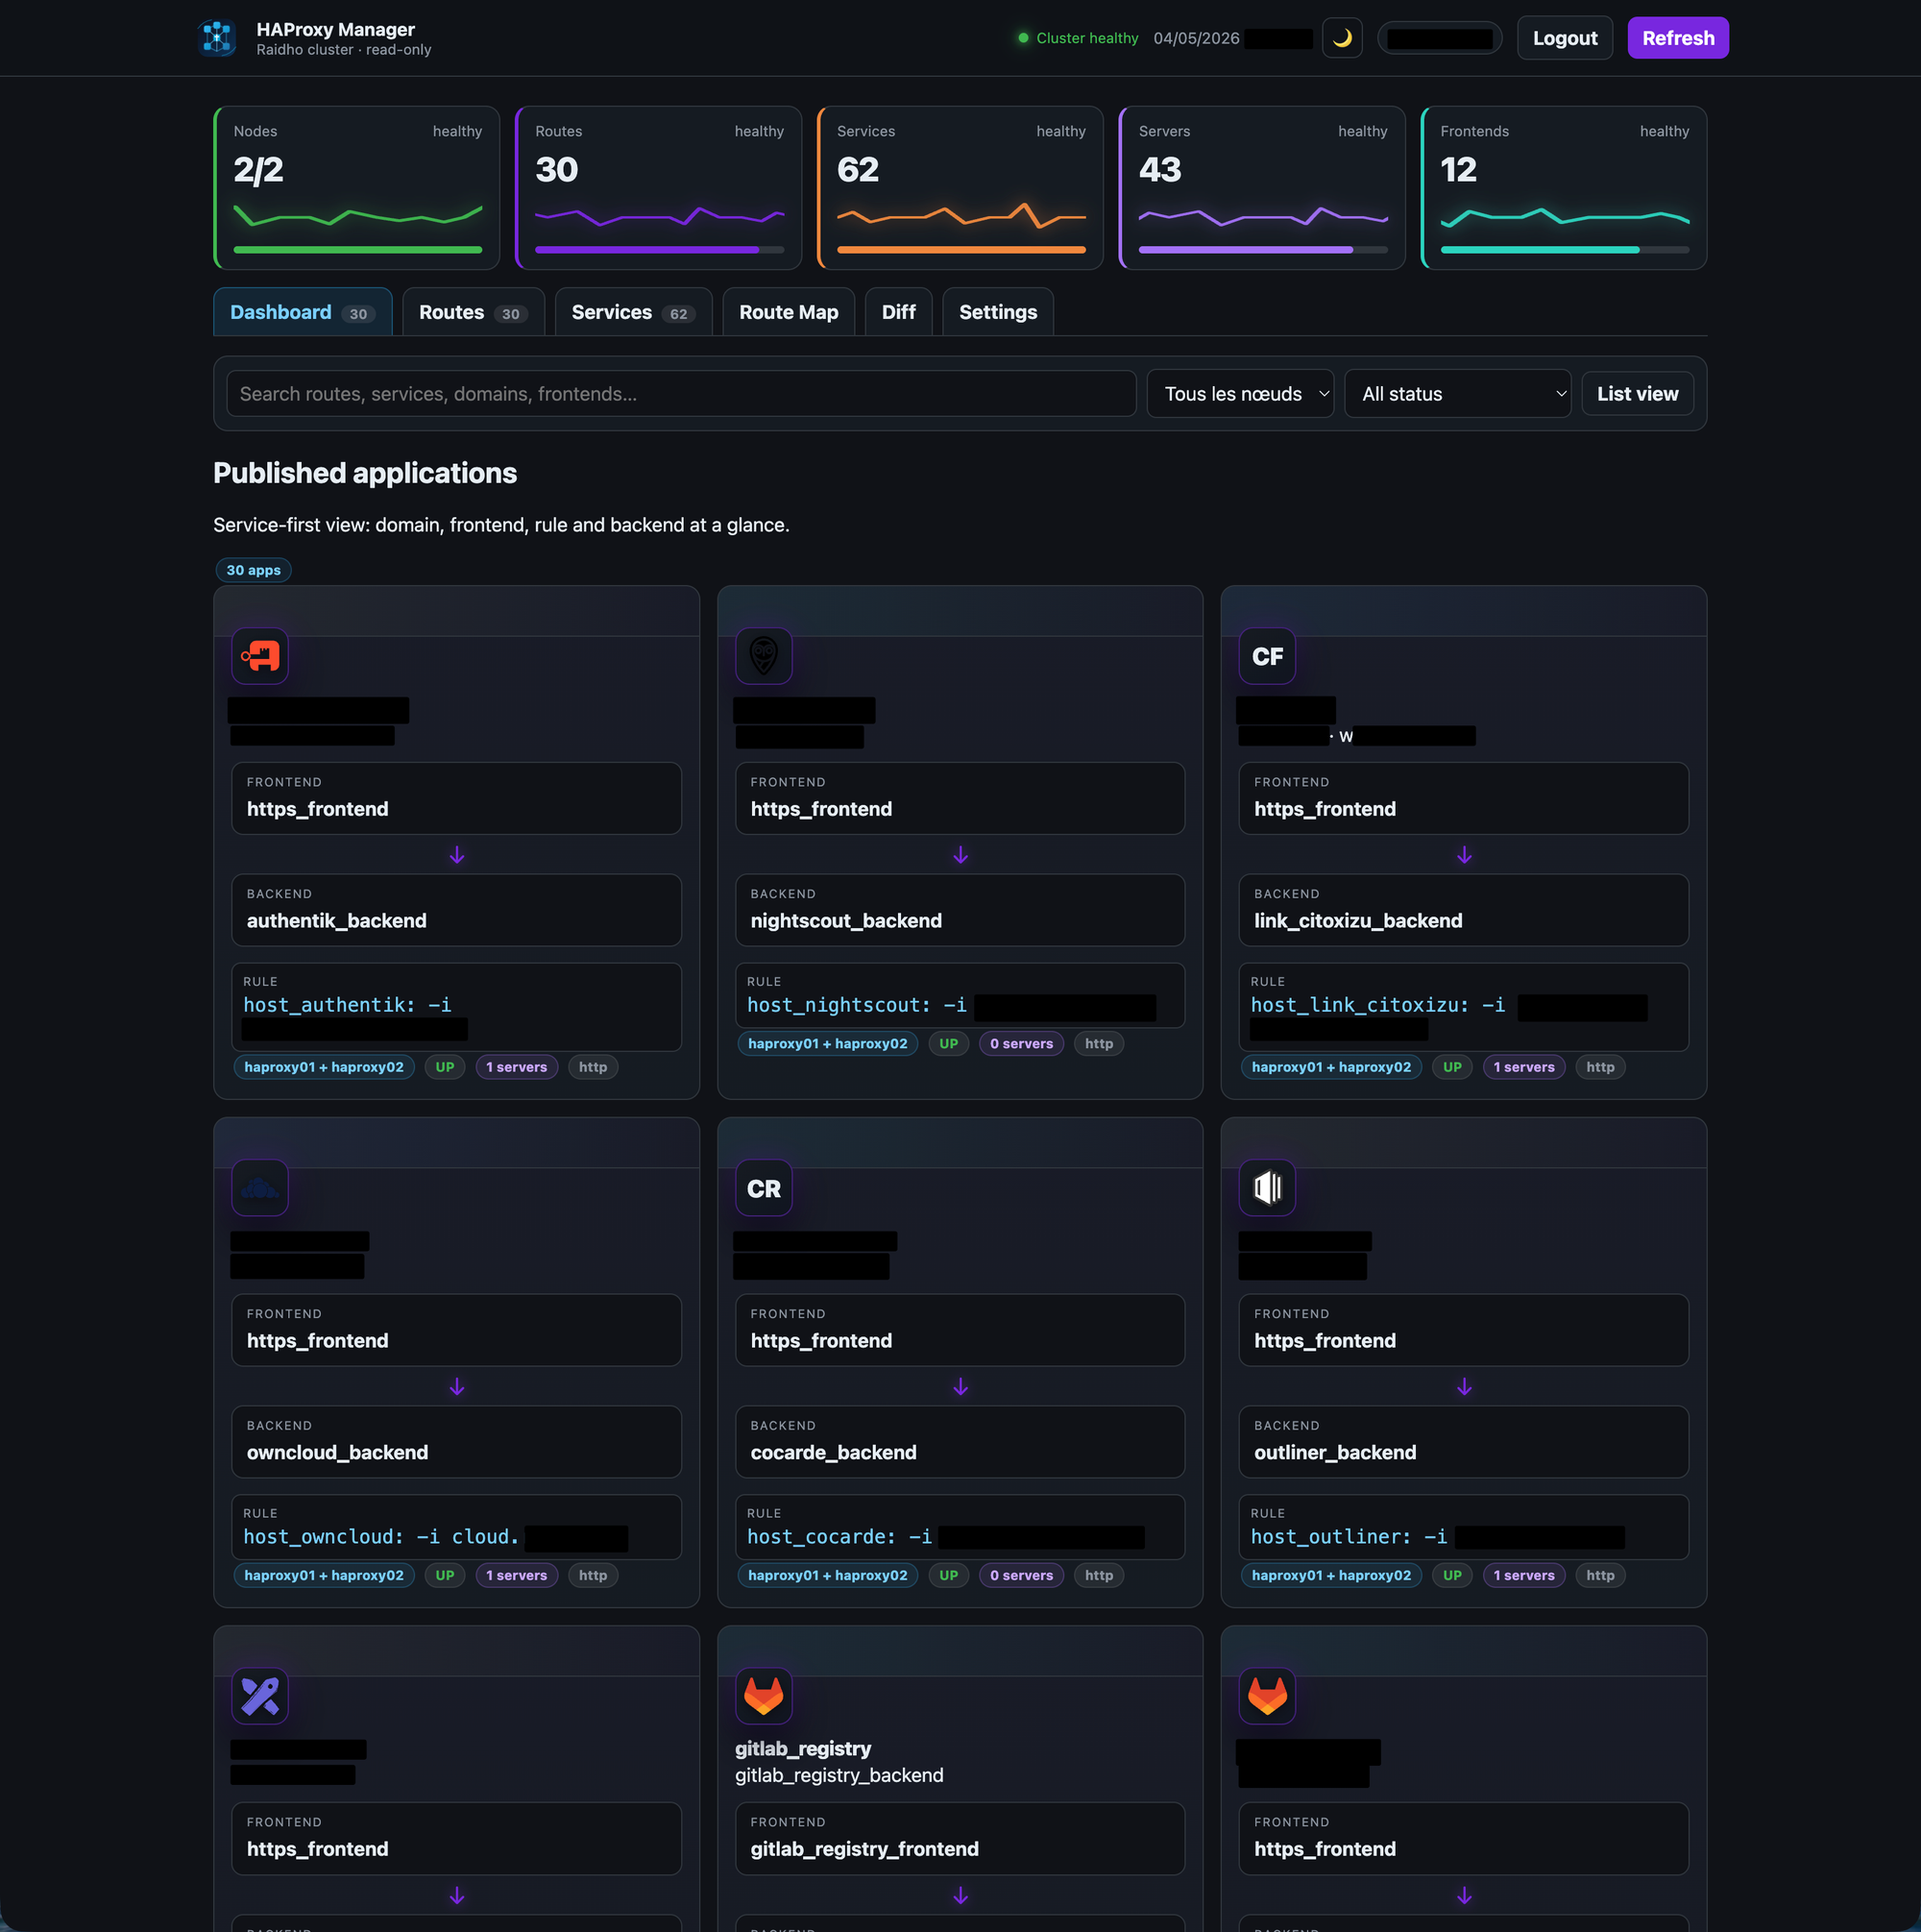
The main dashboard is service-first.
Instead of forcing me to start from a raw frontend or backend list, it shows exposed applications as cards. Each card summarizes the important path:
- domain or service name
- frontend
- backend
- matching rule
- server count
- health state
That view is designed for the moment when you just need to know: “What is this thing, and where does it go?”
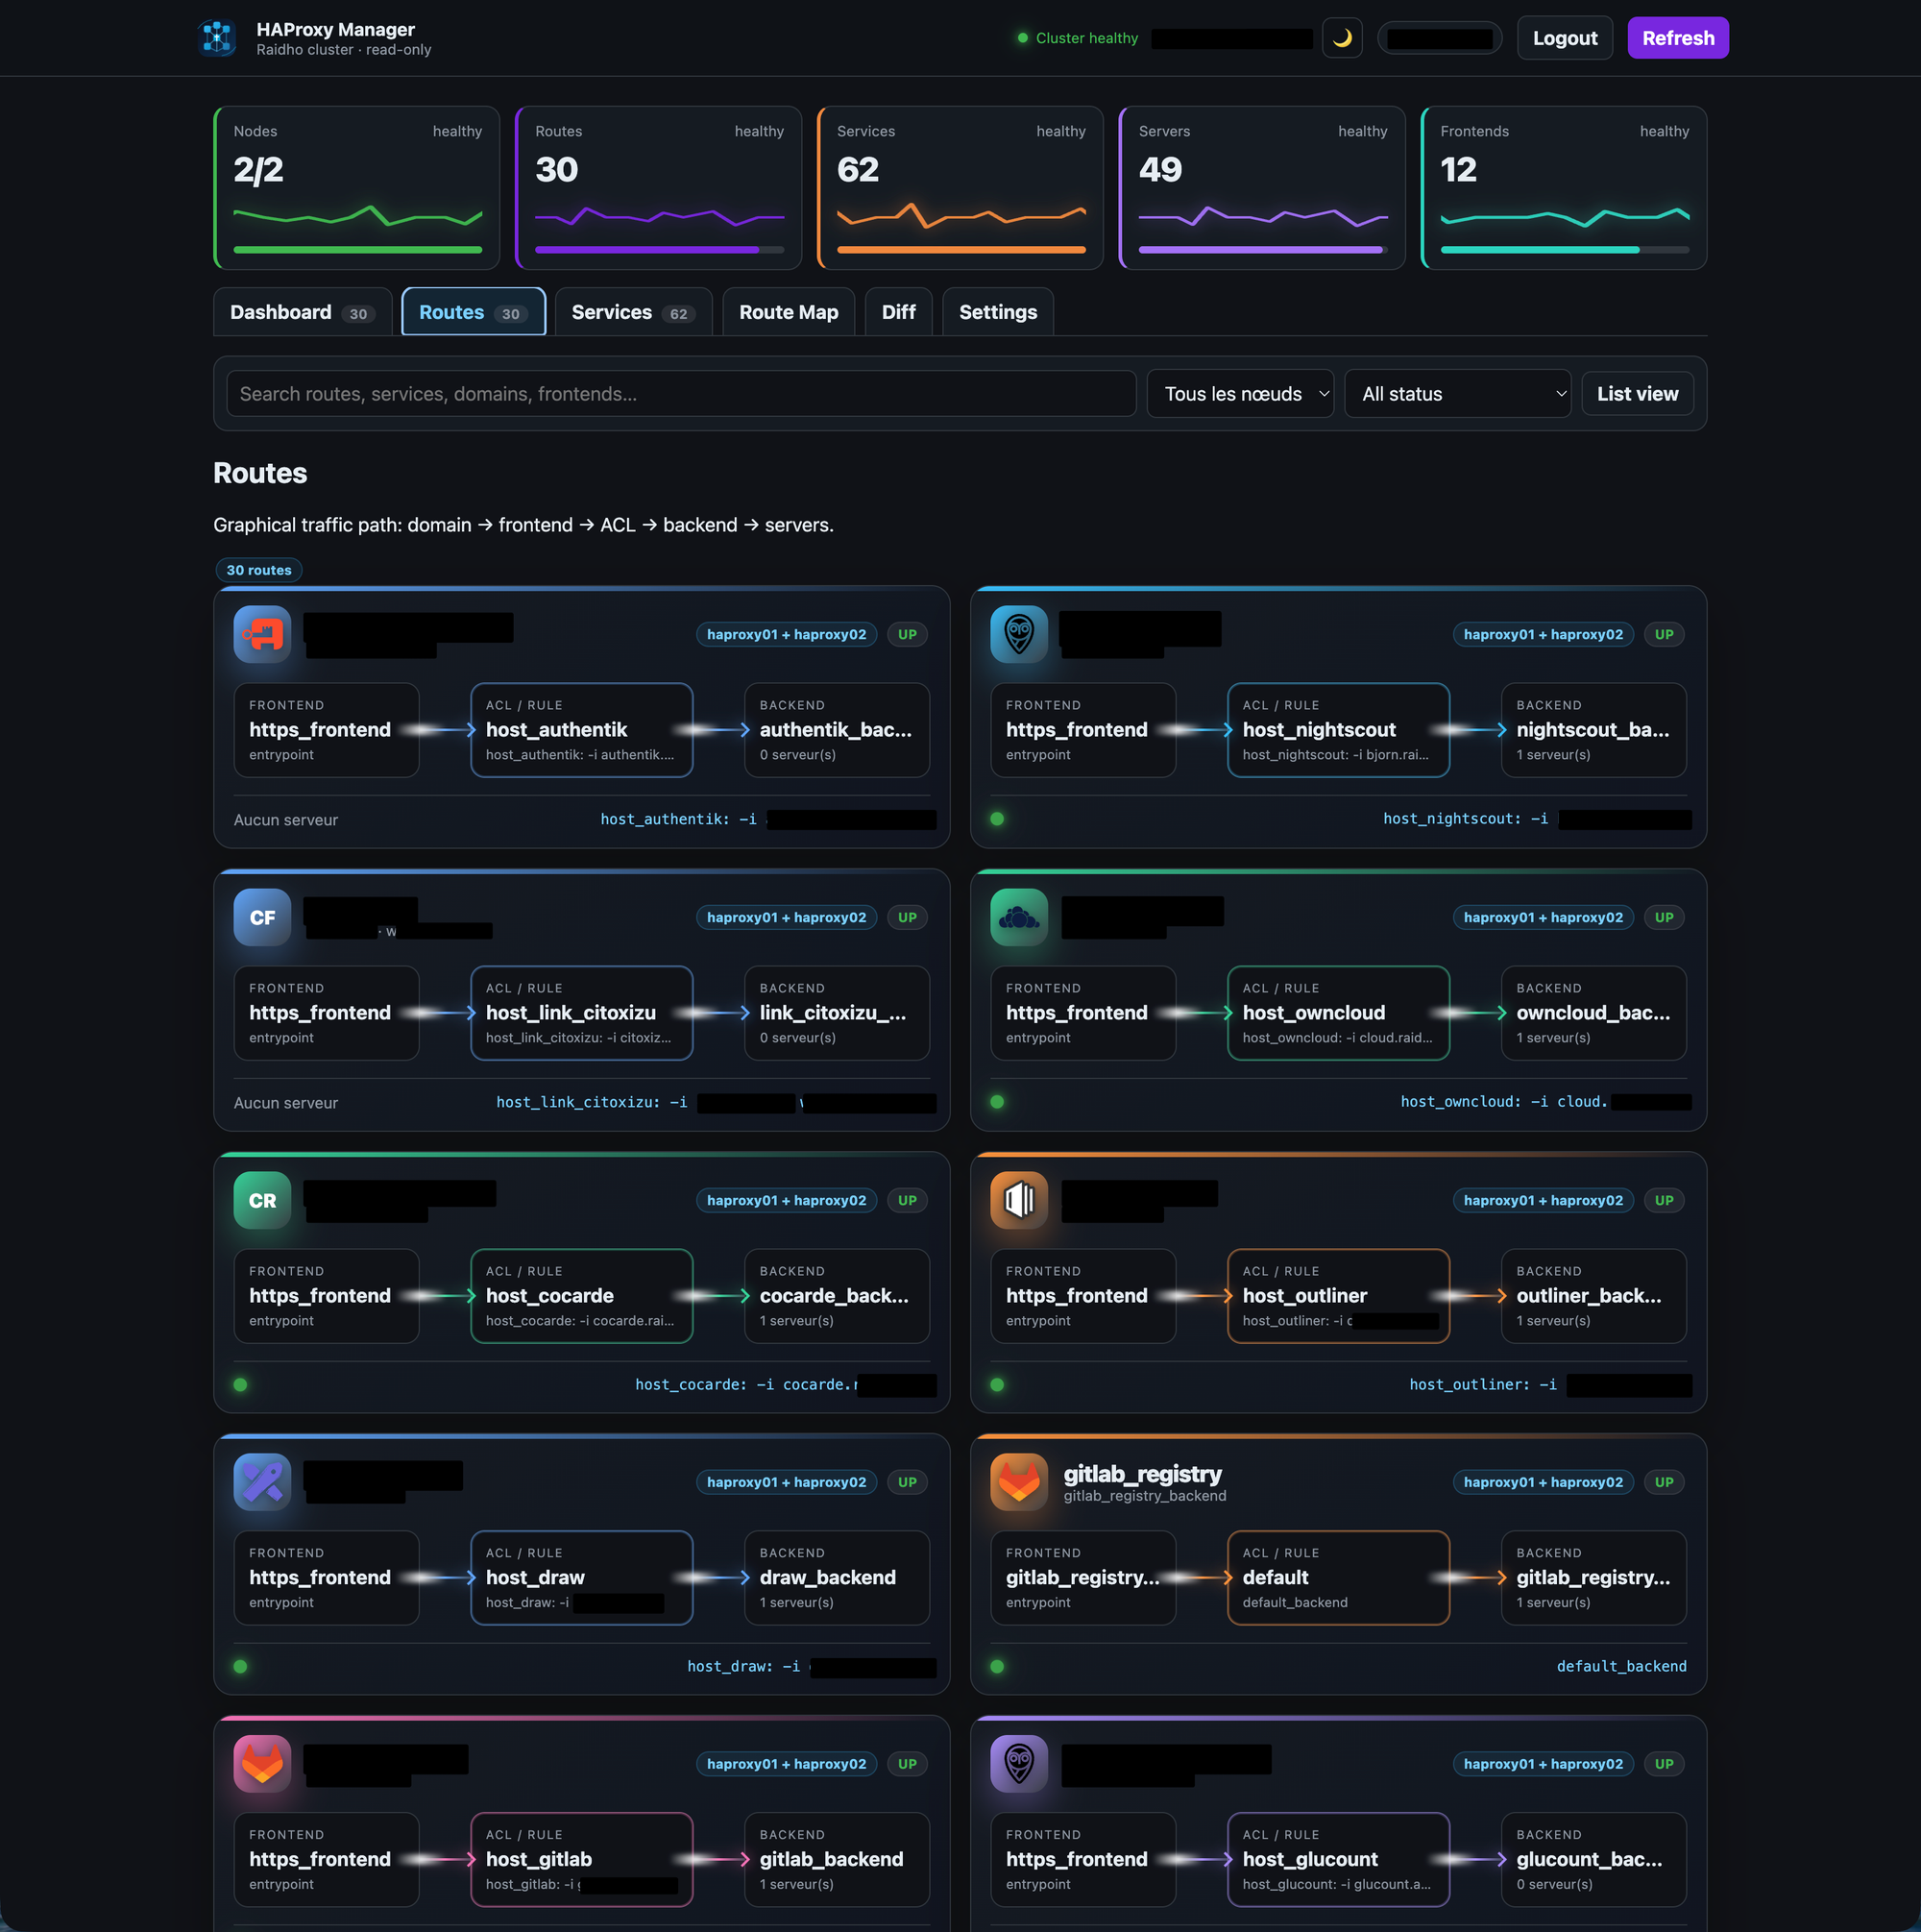
Routes
The Routes view is more explicit. It lays out the flow as:
Frontend
  ↓
ACL / Rule
  ↓
Backend
  ↓
Servers
This is the view I use when I want to understand how a request is routed without mentally reconstructing the full HAProxy configuration.
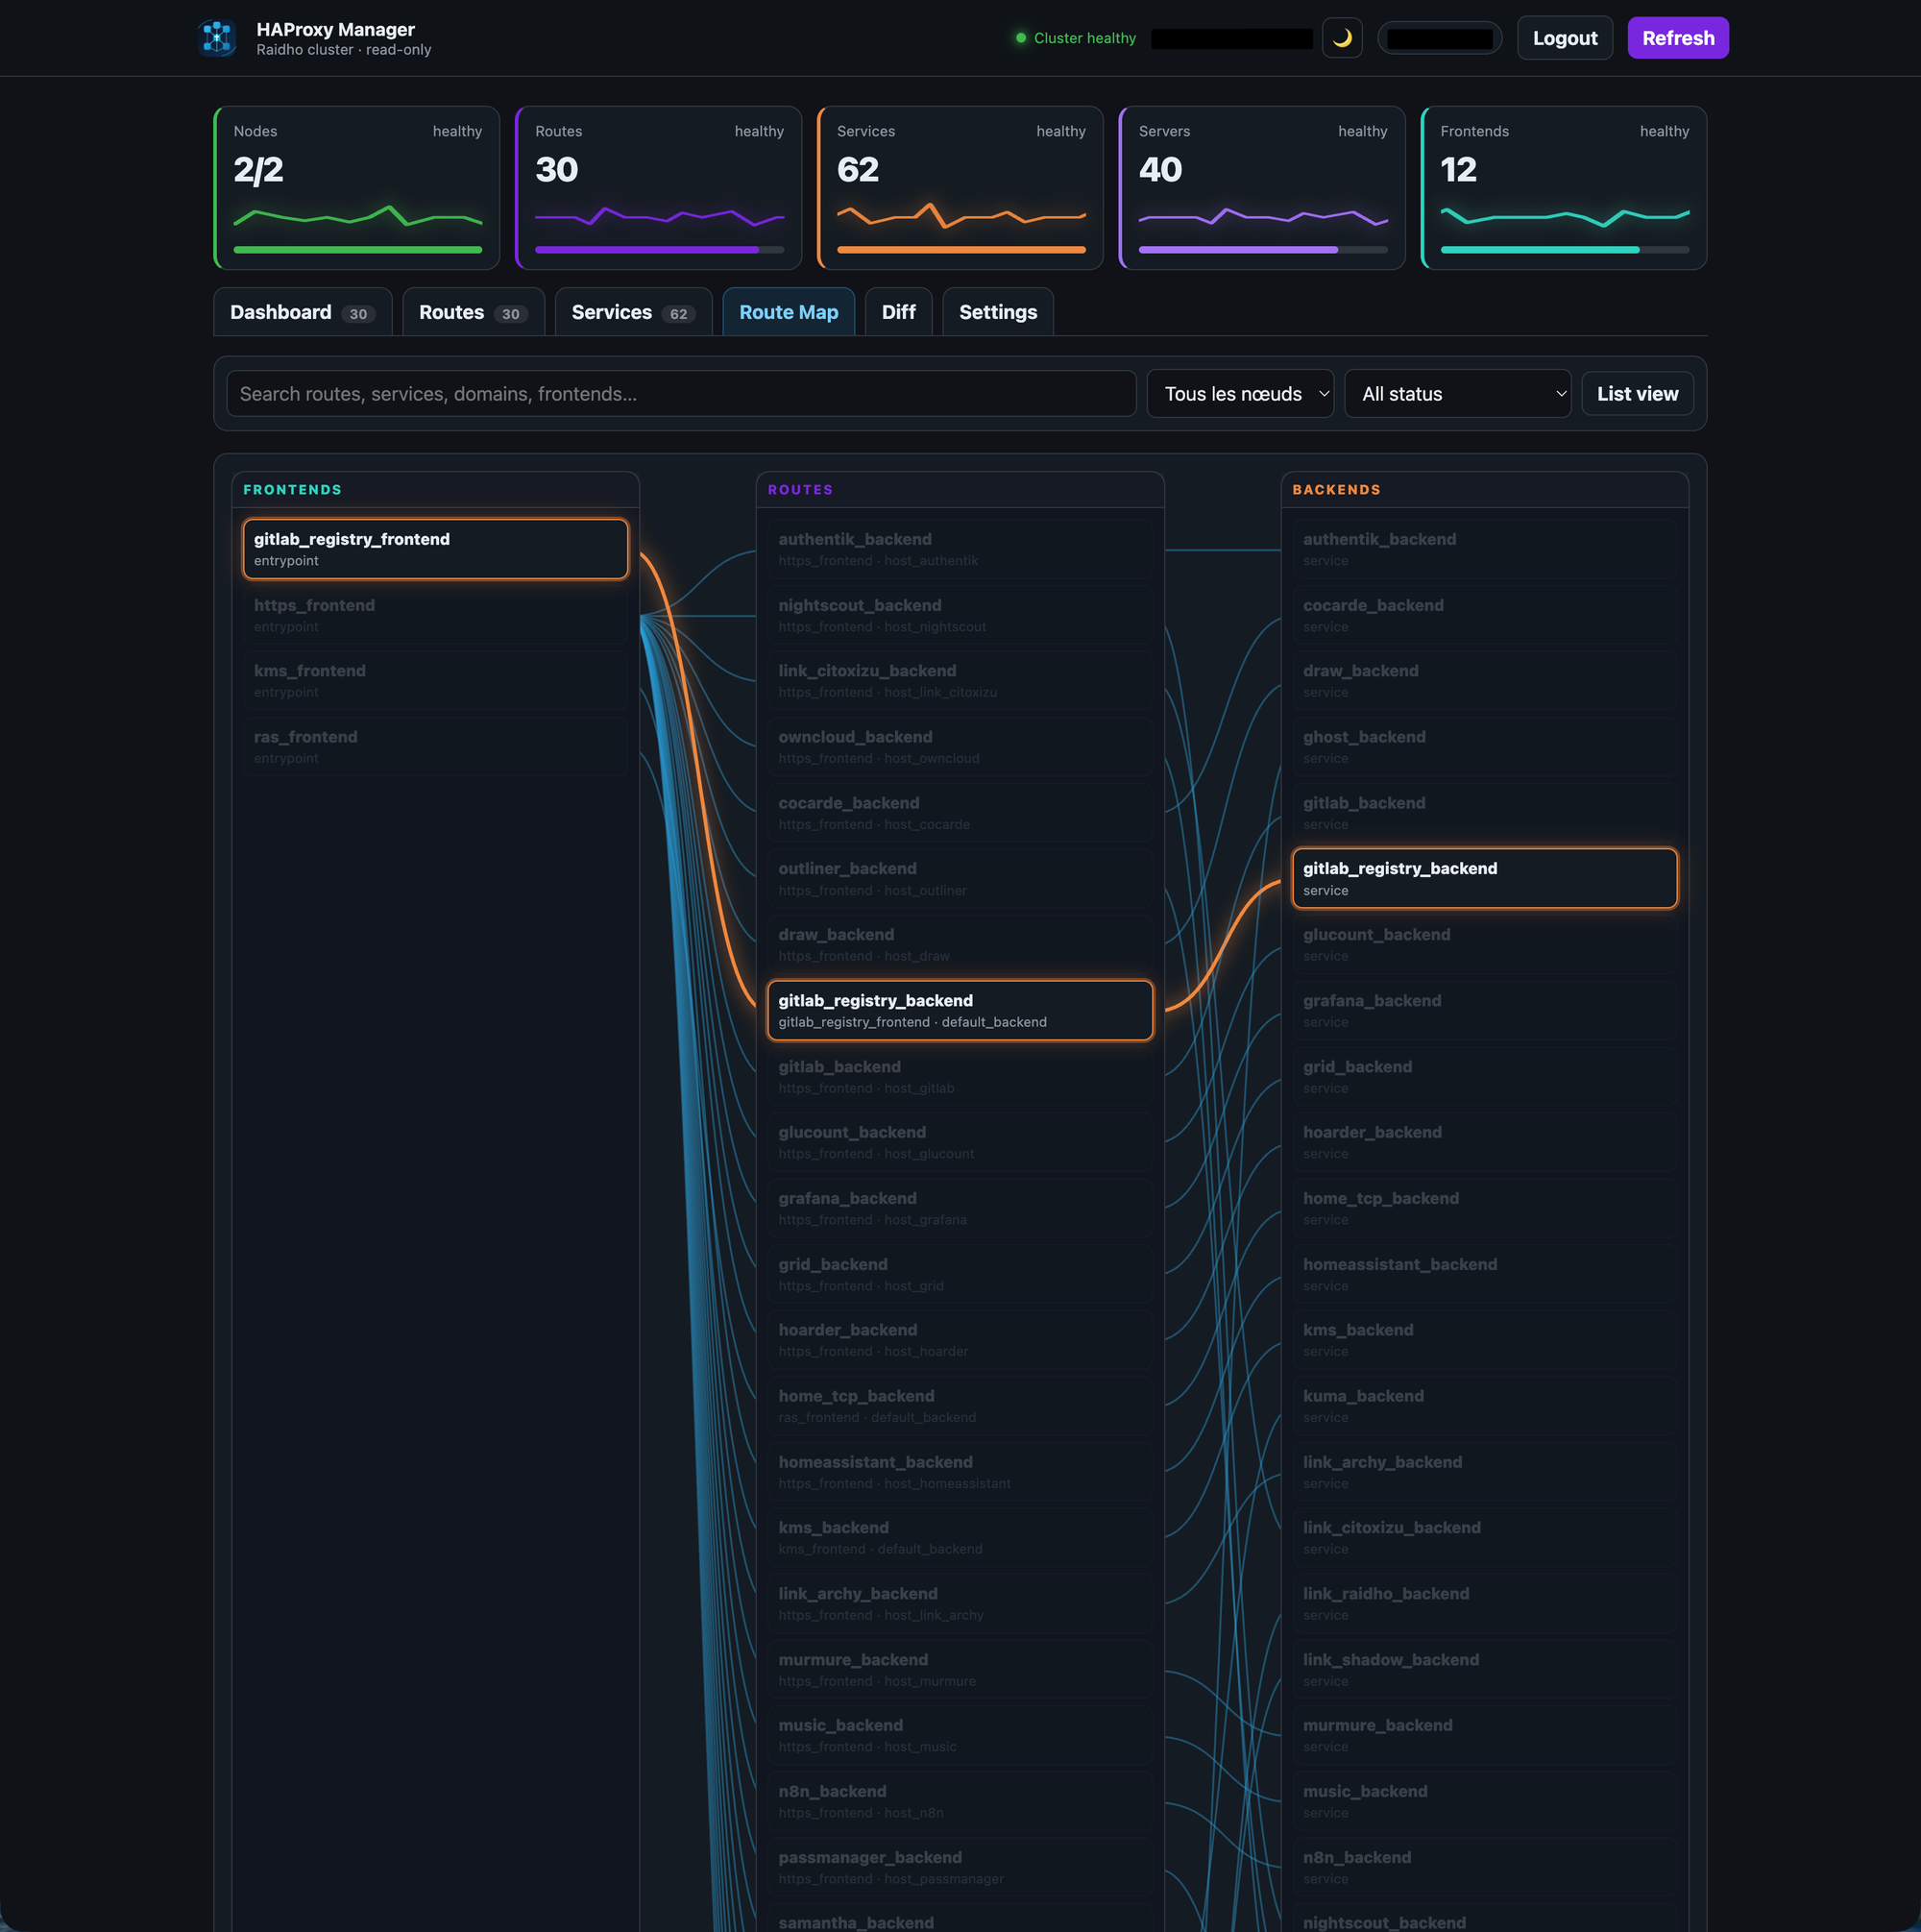
Route map
The Route Map is a graphical view connecting frontends, routes and backends.
It is not trying to be a full network diagram. It is more like a routing map: enough visual structure to understand relationships quickly, without turning the screen into spaghetti.
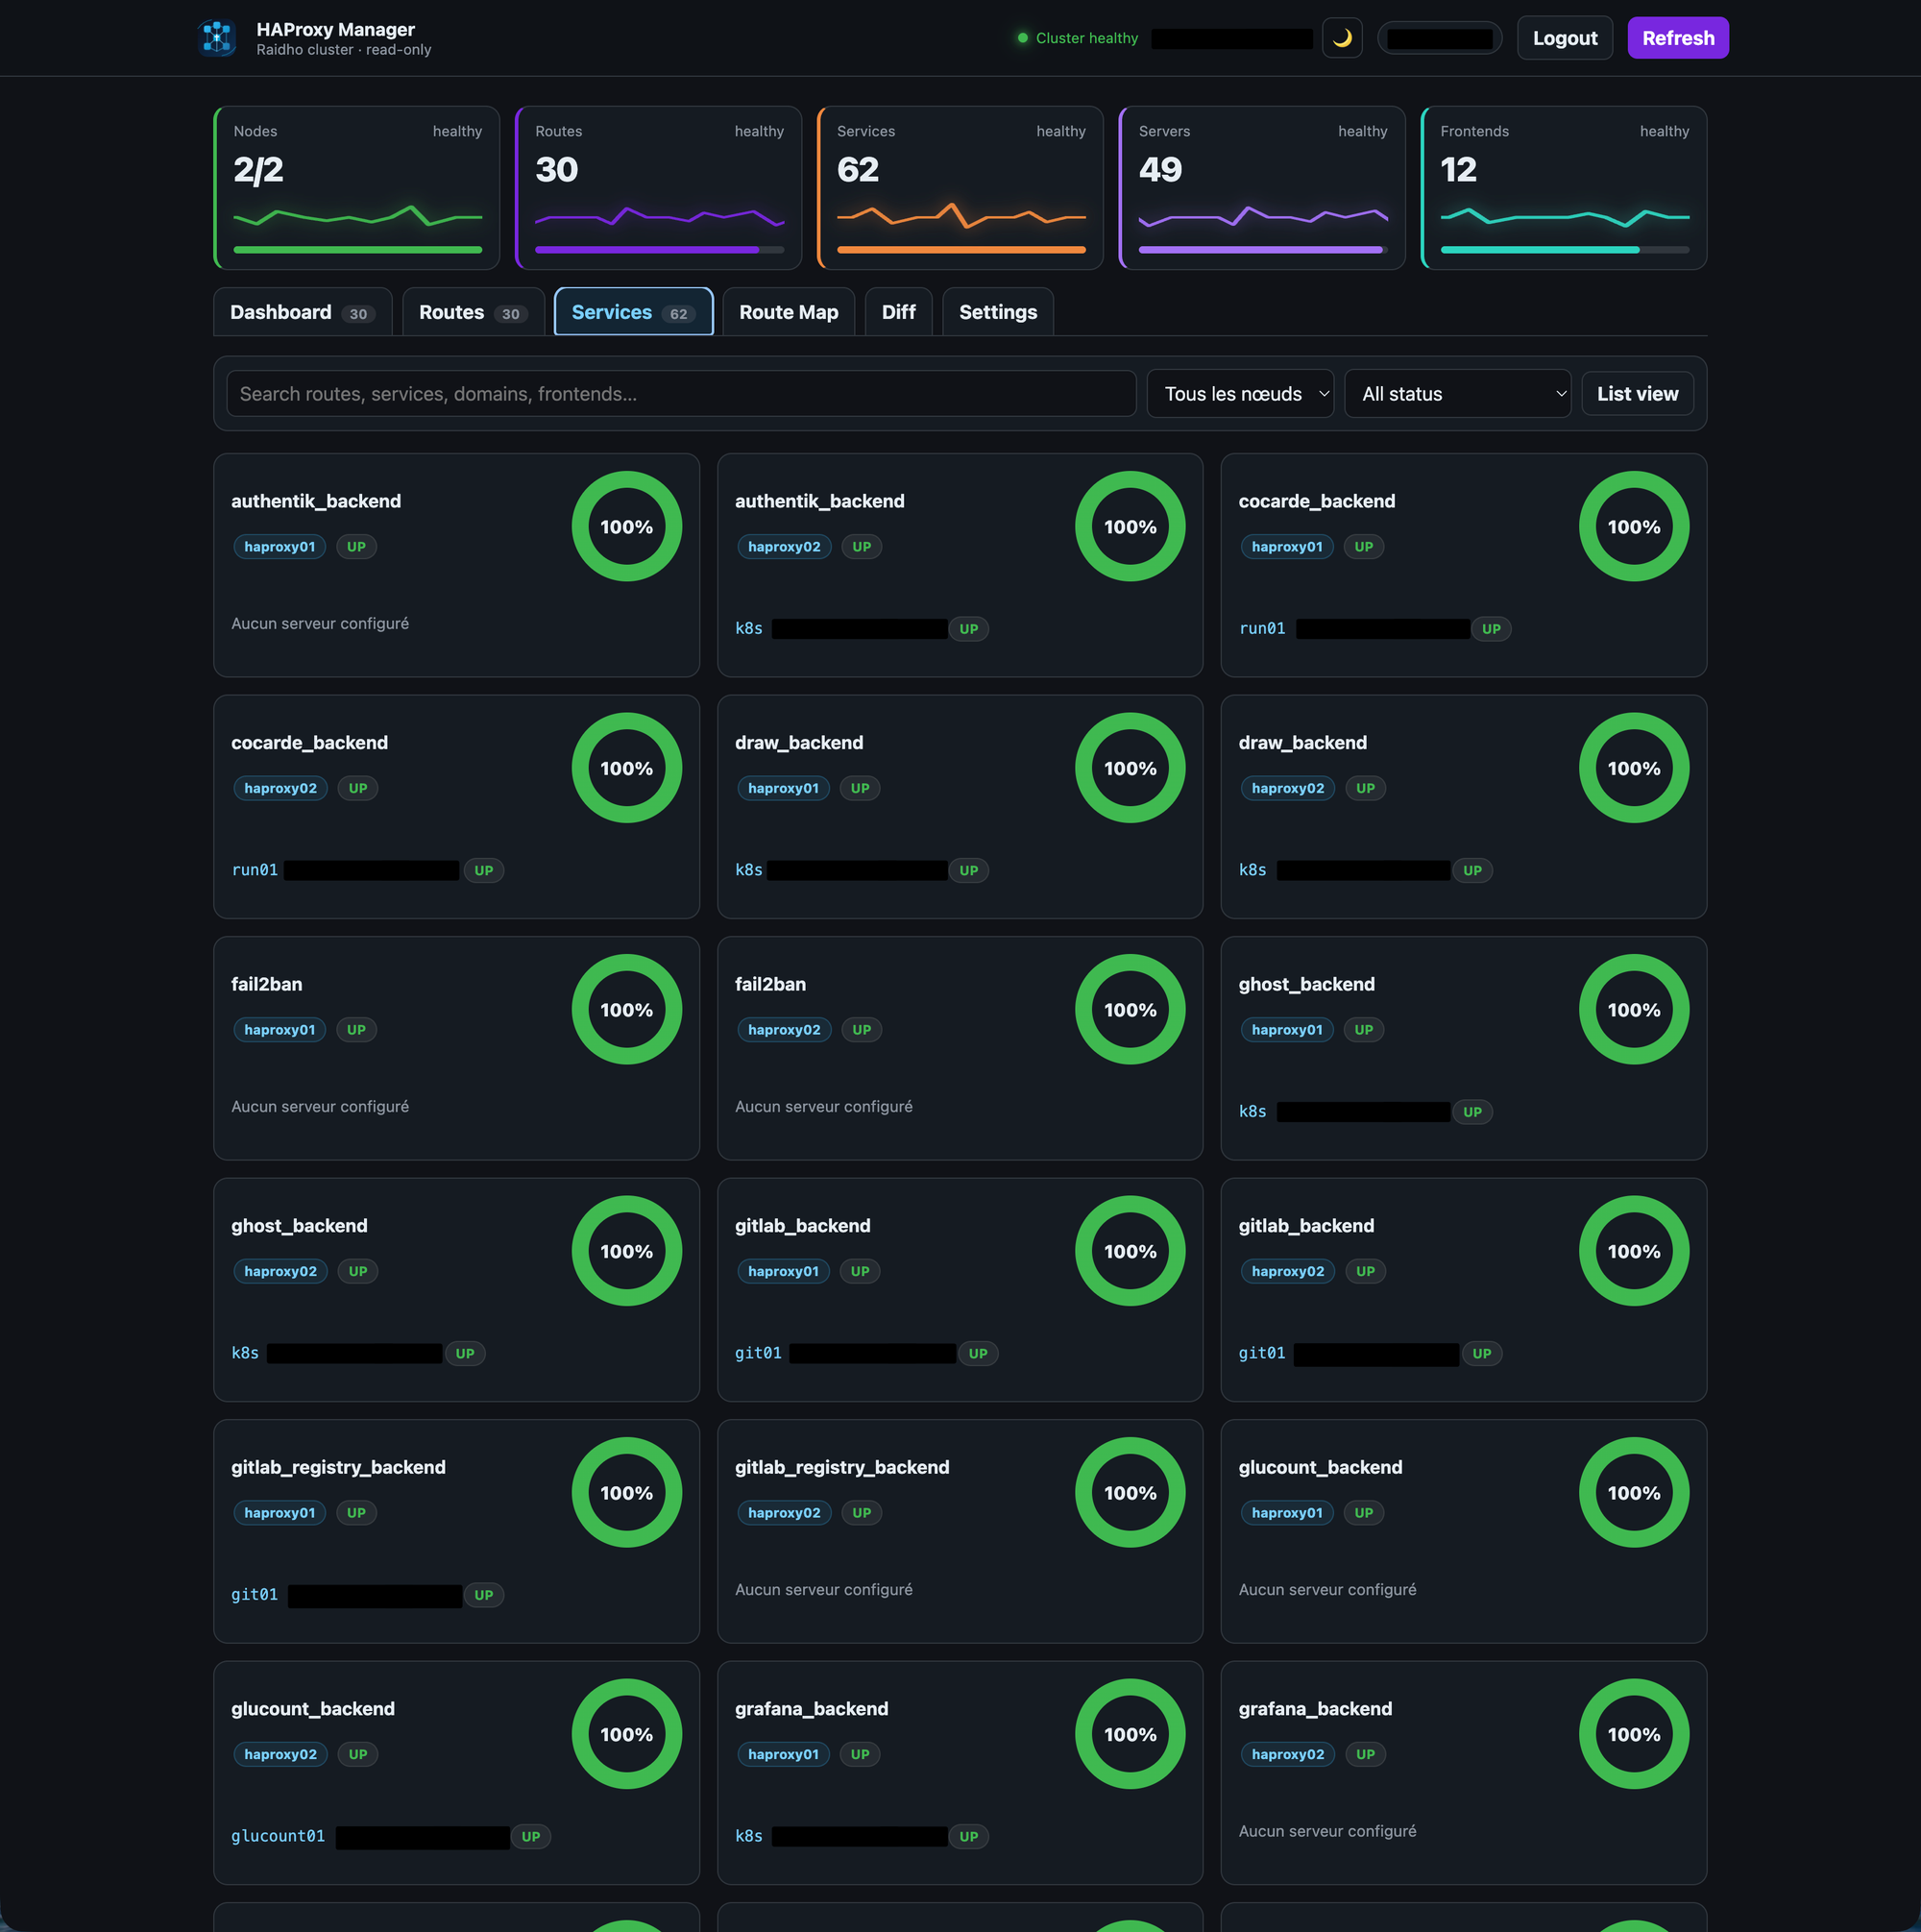
Services
The Services view focuses on backends and their servers.
If a service or server is down, the dashboard makes it obvious with a red glow. If a service is at 0% health, it is red. No subtle gray-on-gray status pill hidden in a corner.
Infrastructure dashboards should not make you hunt for bad news.
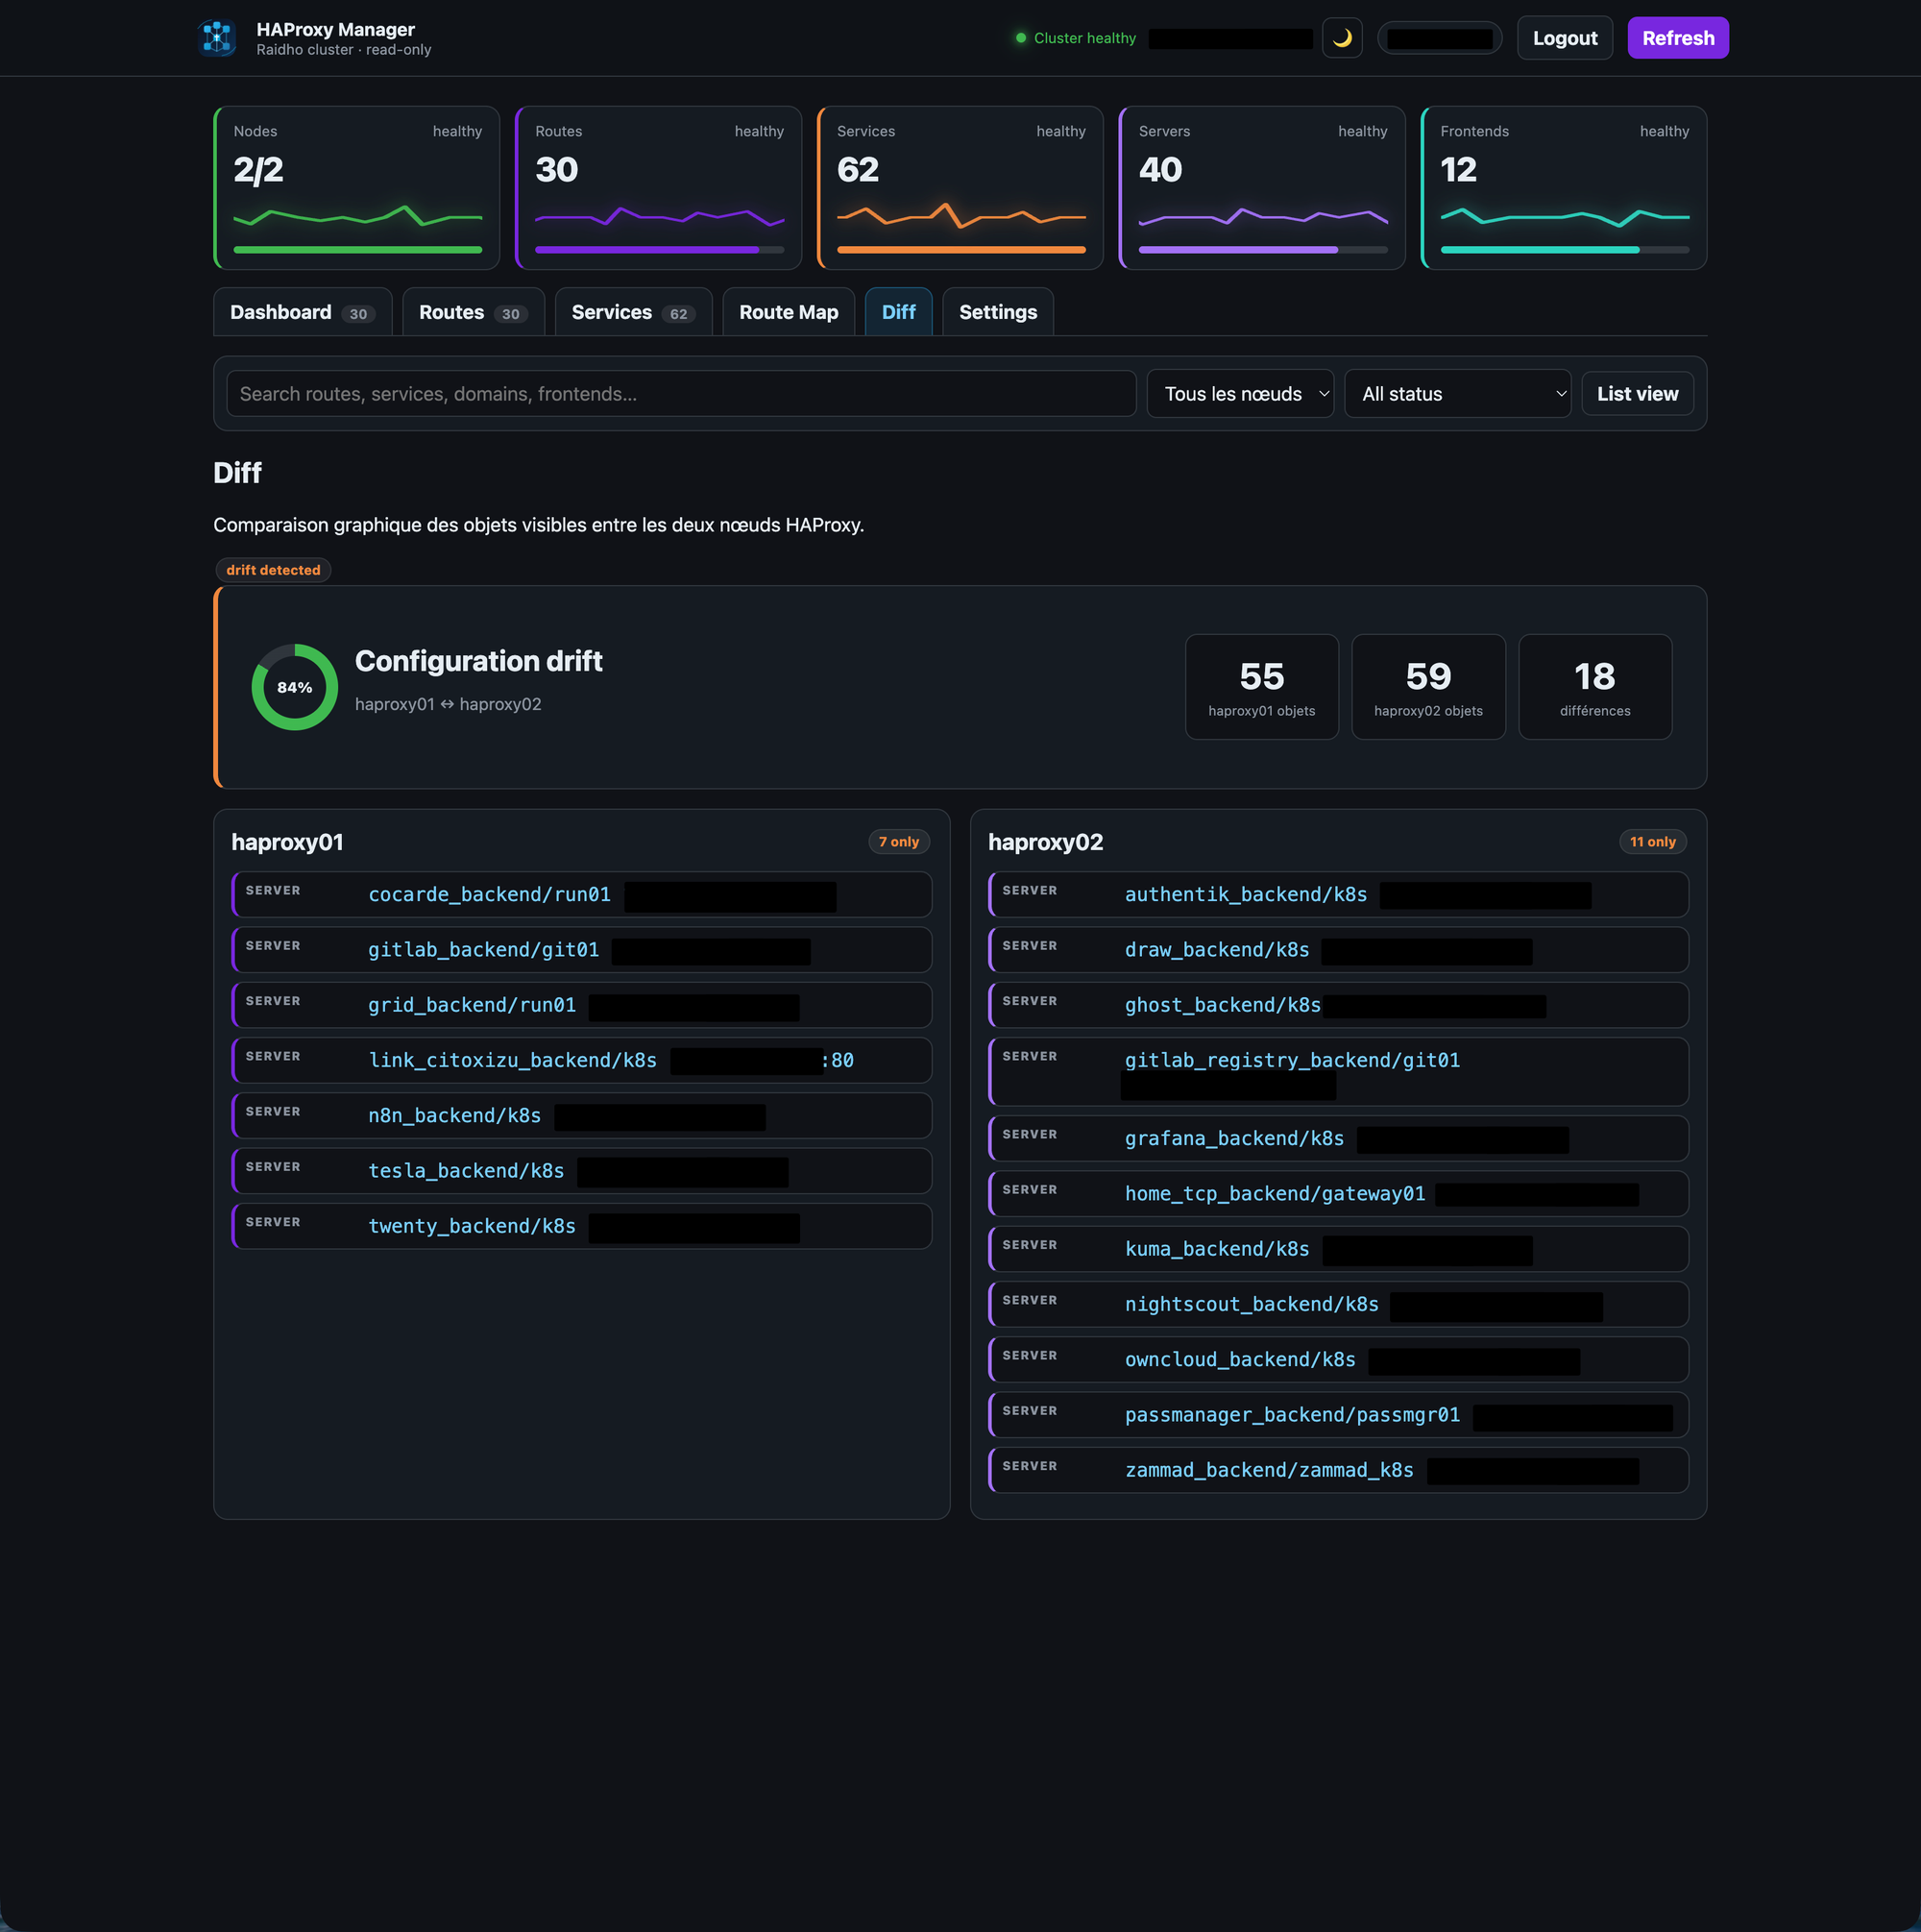
Diff
The Diff view compares the two HAProxy nodes.
It shows whether the visible objects are aligned, and highlights differences by node. The goal is simple: detect configuration drift before it becomes an incident.
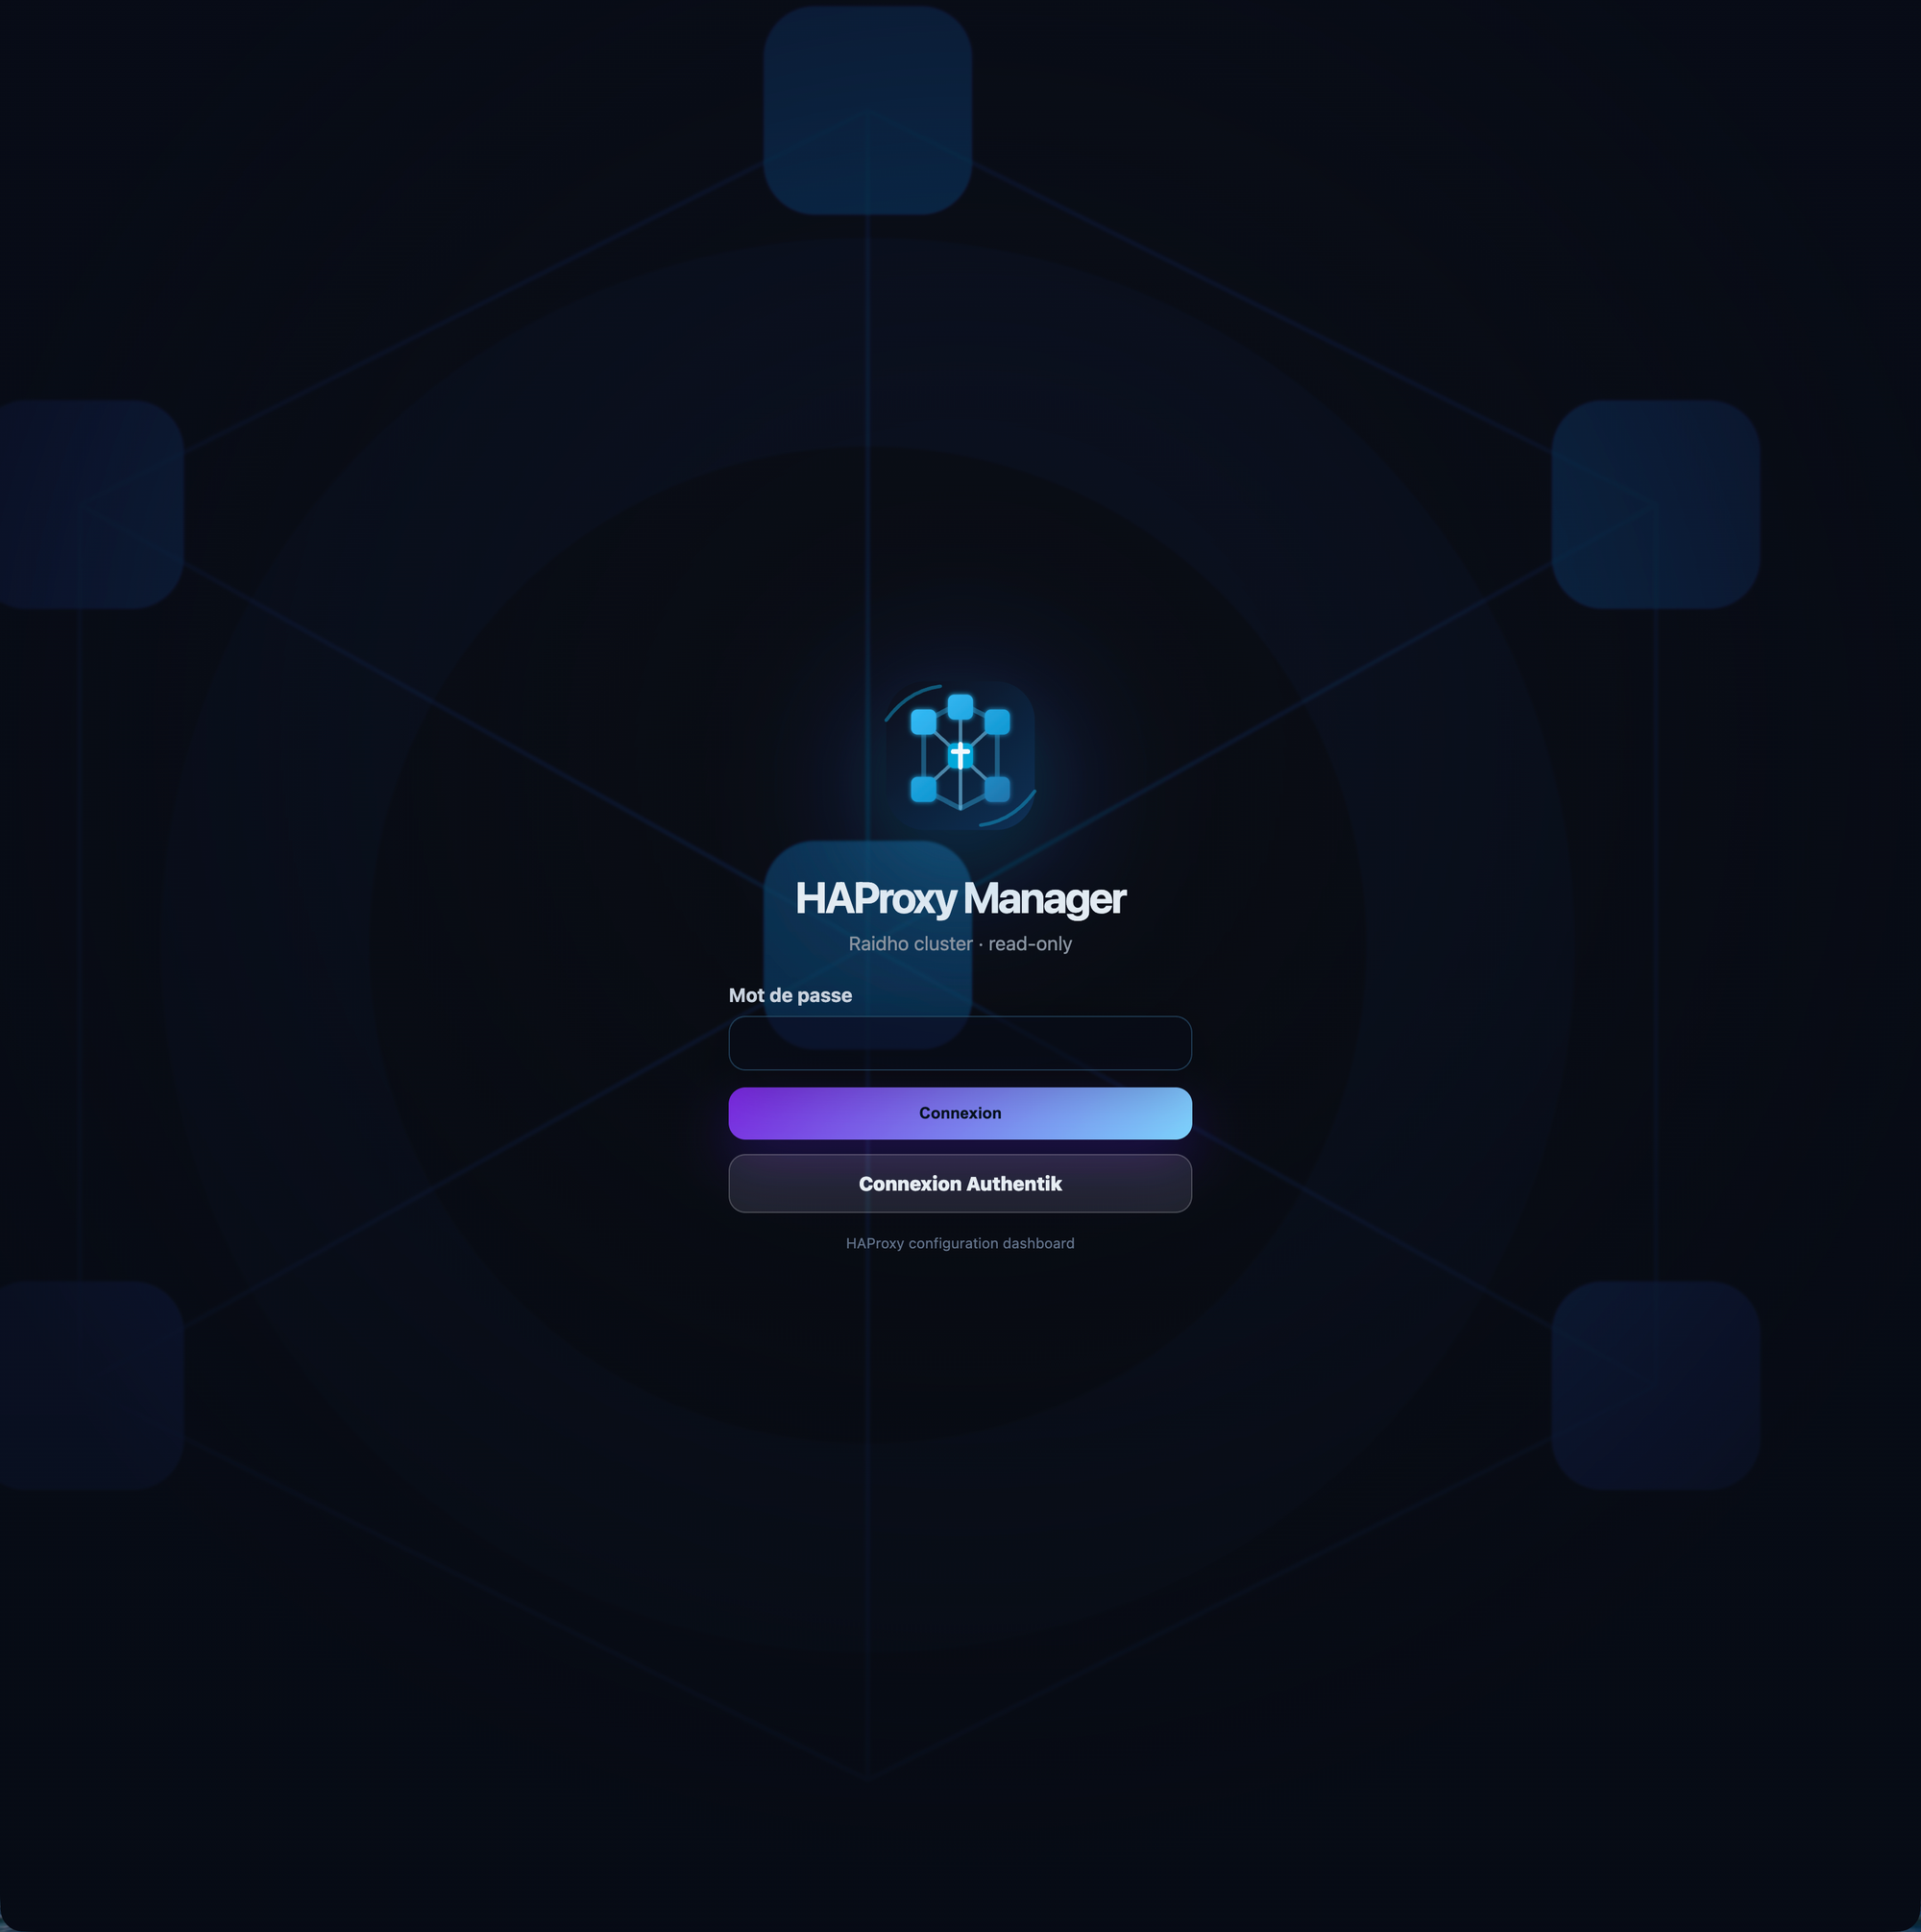
Authentication and settings
The dashboard supports both local authentication and OIDC.
OIDC settings are configurable from the UI:
- provider name
- issuer
- client ID
- client secret
- redirect URI
- allowed emails
The client secret stays server-side. The frontend only knows whether a secret is configured, not what it is.
The settings page also controls branding, language, default tab after login, theme, logo, and visual style for the application cards.
Making it pleasant to use
I did not want another lifeless internal admin page.
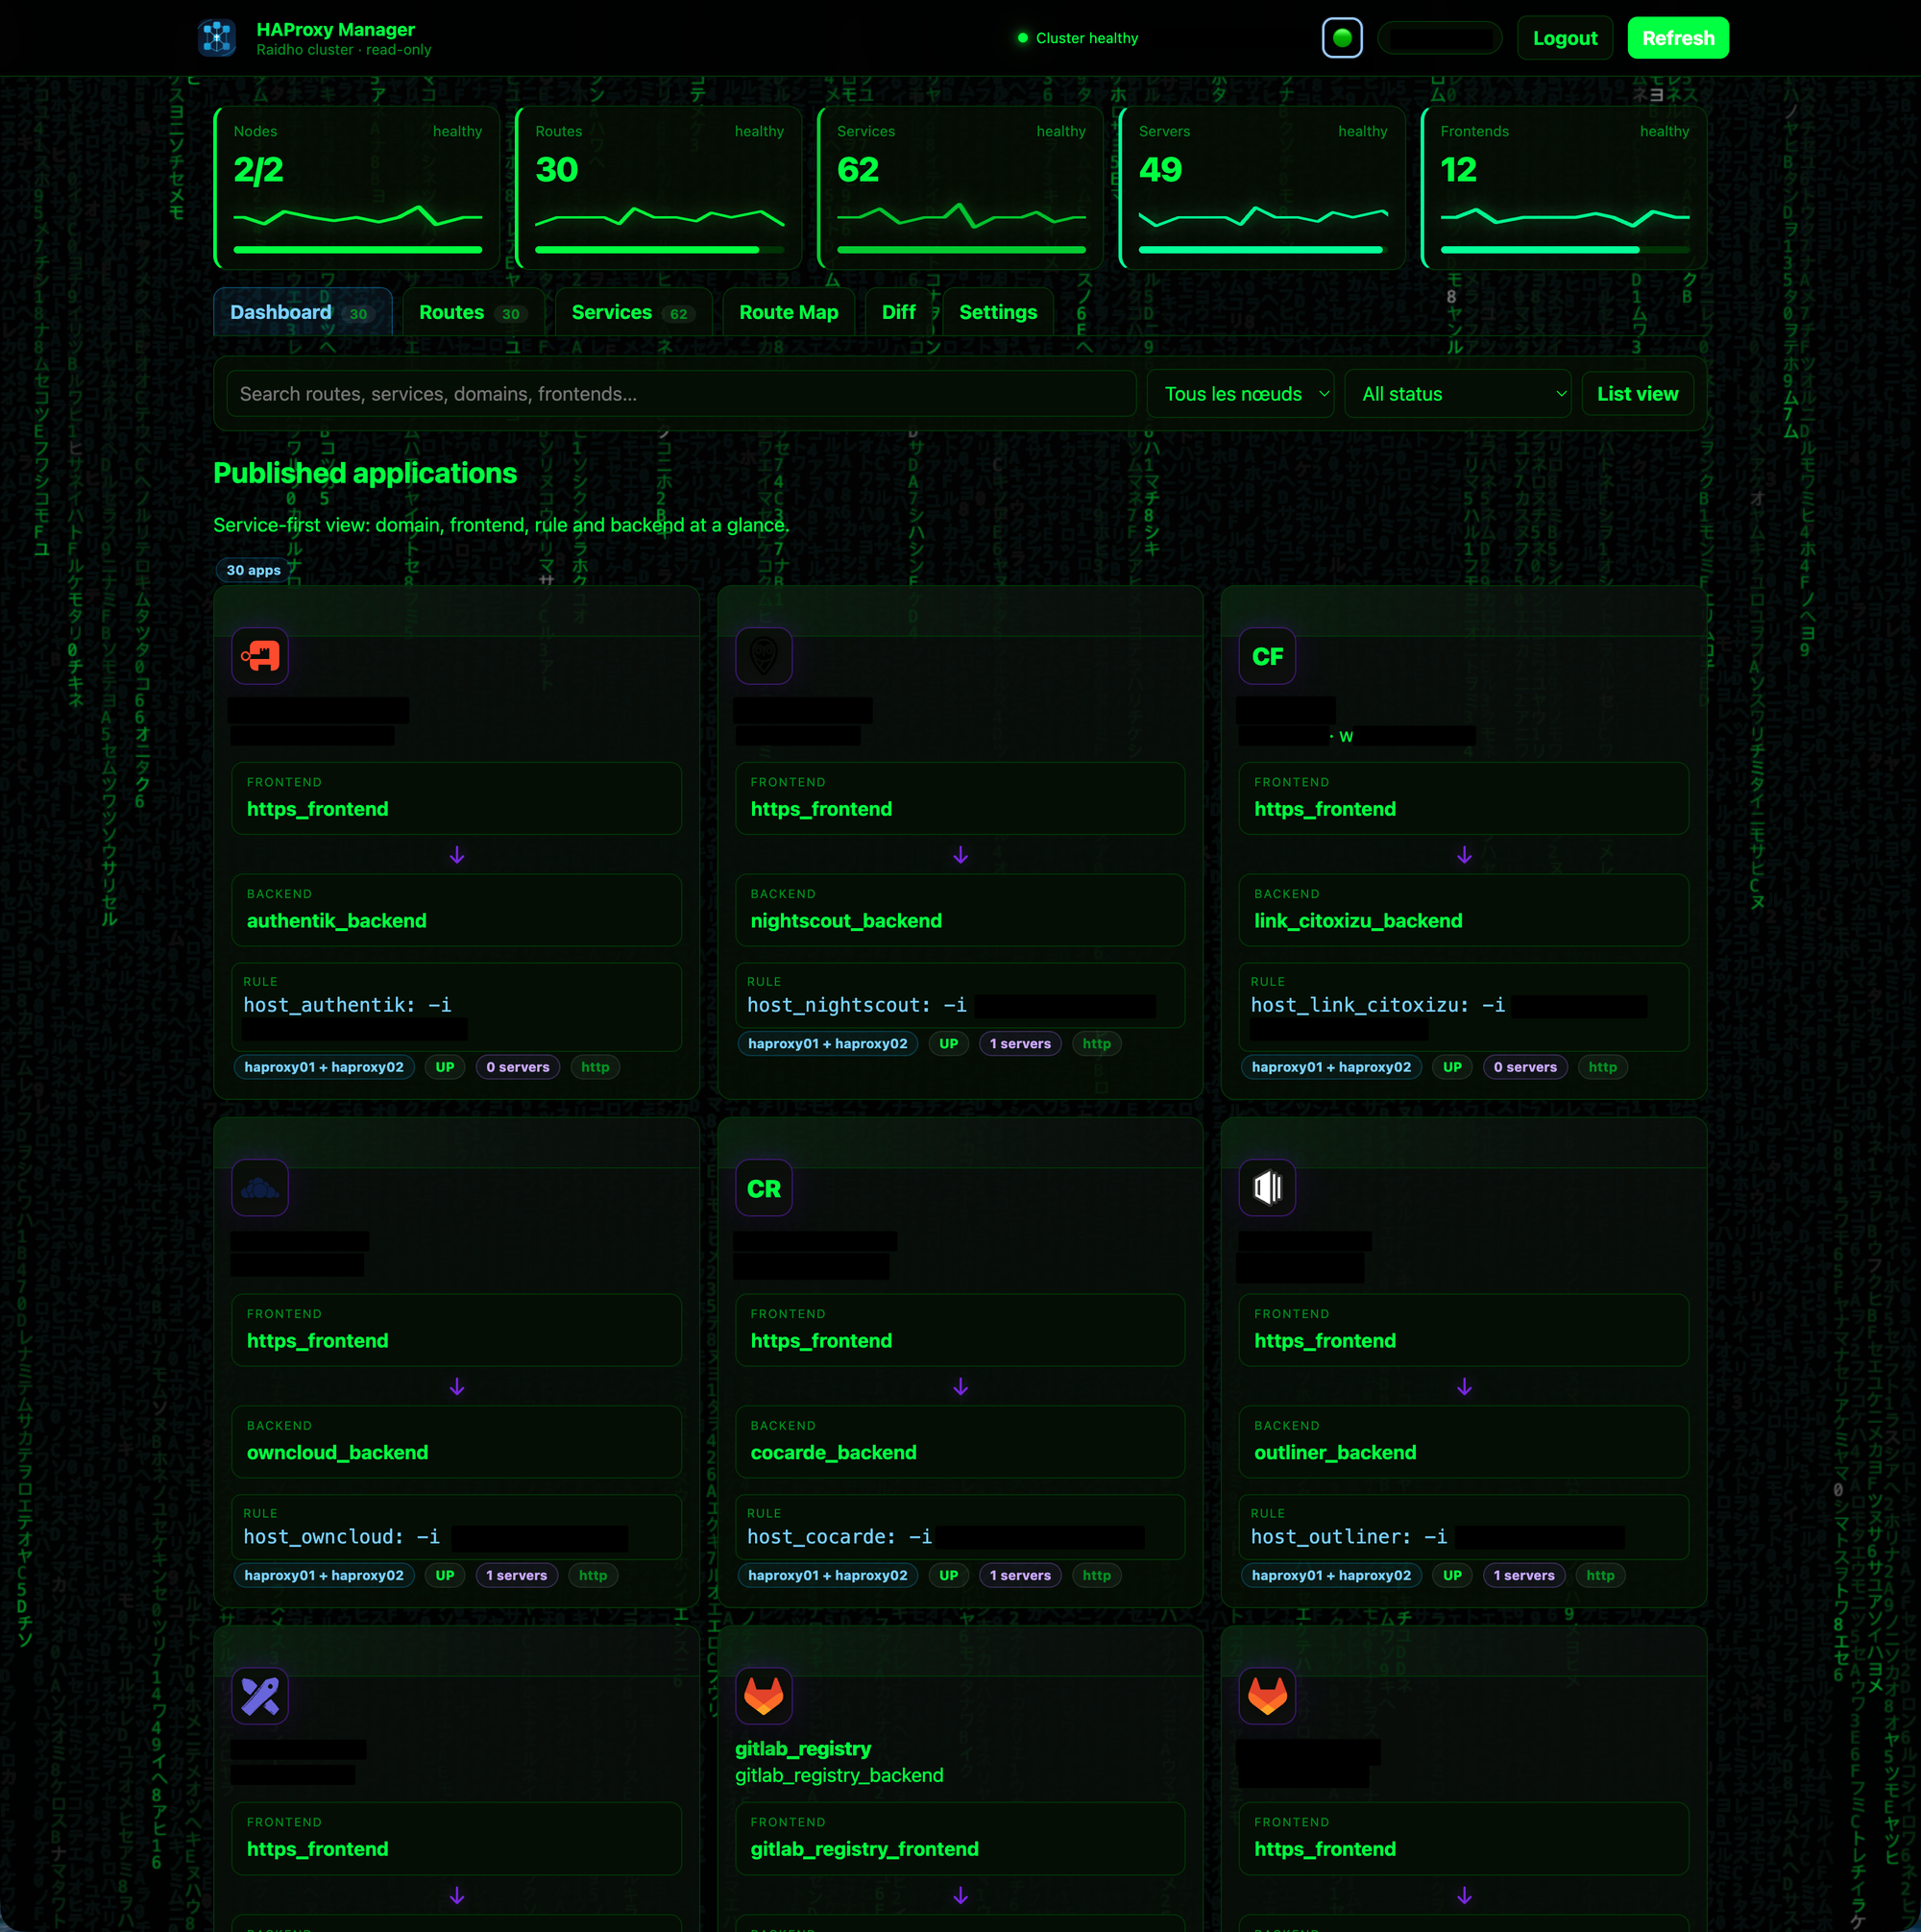
The dashboard has multiple themes, including dark, light, cloud and matrix. The login screen rotates through abstract HAProxy-inspired backgrounds. Cards can use different visual motifs, from minimalist to more hi-tech patterns.
The top metric cards include slow ECG-style traces. Not because it is necessary, but because it gives the interface a little life while still reflecting state. Healthy, watch and risk states behave differently.
There is also a practical reason for the visual treatment: color and motion are very fast to parse. A red glow around a card tells you something is wrong before you read a single word.
Under the hood
The application is a small Node.js service with a static frontend, built entirely around HAProxy control-plane APIs.
It collects data from:
- HAProxy Data Plane API for configuration objects exposed by the control plane
- HAProxy runtime stats for live server health
- a local server-side settings file for UI preferences
The deployment is intentionally boring: a container, a persistent data volume for settings, and a unique Compose project name so it does not collide with anything else running on the host.
End
HAProxy does not need to be simplified. Its precision is the point, but operating HAProxy can absolutely be made more readable.
This dashboard is my attempt at that: a safe, read-only, human-friendly layer on top of a very reliable piece of infrastructure.
And yes, it has a matrix theme.